SP500 Session Gap Fade StrategySummary in one paragraph
SPX Session Gap Fade is an intraday gap fade strategy for index futures, designed around regular cash sessions on five minute charts. It helps you participate only when there is a full overnight or pre session gap and a valid intraday session window, instead of trading every open. The original part is the gap distance engine which anchors both stop and optional target to the previous session reference close at a configurable flat time, so every trade’s risk scales with the actual gap size rather than a fixed tick stop.
Scope and intent
• Markets. Primarily index futures such as ES, NQ, YM, and liquid index CFDs that exhibit overnight gaps and regular cash hours.
• Timeframes. Intraday timeframes from one minute to fifteen minutes. Default usage is five minute bars.
• Default demo used in the publication. Symbol CME:ES1! on a five minute chart.
• Purpose. Provide a simple, transparent way to trade opening gaps with a session anchored risk model and forced flat exit so you are not holding into the last part of the session.
• Limits. This is a strategy. Orders are simulated on standard candles only.
Originality and usefulness
• Unique concept or fusion. The core novelty is the combination of a strict “full gap” entry condition with a session anchored reference close and a gap distance based TP and SL engine. The stop and optional target are symmetric multiples of the actual gap distance from the previous session’s flat close, rather than fixed ticks.
• Failure mode it addresses. Fixed sized stops do not scale when gaps are unusually small or unusually large, which can either under risk or over risk the account. The session flat logic also reduces the chance of holding residual positions into late session liquidity and news.
• Testability. All key pieces are explicit in the Inputs: session window, minutes before session end, whether to use gap exits, whether TP or SL are active, and whether to allow candle based closes and forced flat. You can toggle each component and see how it changes entries and exits.
• Portable yardstick. The main unit is the absolute price gap between the entry bar open and the previous session reference close. tp_mult and sl_mult are multiples of that gap, which makes the risk model portable across contracts and volatility regimes.
Method overview in plain language
The strategy first defines a trading session using exchange time, for example 08:30 to 15:30 for ES day hours. It also defines a “flat” time a fixed number of minutes before session end. At the flat bar, any open position is closed and the bar’s close price is stored as the reference close for the next session. Inside the session, the strategy looks for a full gap bar relative to the prior bar: a gap down where today’s high is below yesterday’s low, or a gap up where today’s low is above yesterday’s high. A full gap down generates a long entry; a full gap up generates a short entry. If the gap risk engine is enabled and a valid reference close exists, the strategy measures the distance between the entry bar open and that reference close. It then sets a stop and optional target as configurable multiples of that gap distance and manages them with strategy.exit. Additional exits can be triggered by a candle color flip or by the forced flat time.
Base measures
• Range basis. The main unit is the absolute difference between the current entry bar open and the stored reference close from the previous session flat bar. That value is used as a “gap unit” and scaled by tp_mult and sl_mult to build the target and stop.
Components
• Component one: Gap Direction. Detects full gap up or full gap down by comparing the current high and low to the previous bar’s high and low. Gap down signals a long fade, gap up signals a short fade. There is no smoothing; it is a strict structural condition.
• Component two: Session Window. Only allows entries when the current time is within the configured session window. It also defines a flat time before the session end where positions are forced flat and the reference close is updated.
• Component three: Gap Distance Risk Engine. Computes the absolute distance between the entry open and the stored reference close. The stop and optional target are placed as entry ± gap_distance × multiplier so that risk scales with gap size.
• Optional component: Candle Exit. If enabled, a bullish bar closes short positions and a bearish bar closes long positions, which can shorten holding time when price reverses quickly inside the session.
• Session windows. Session logic uses the exchange time of the chart symbol. When changing symbols or venues, verify that the session time string still matches the new instrument’s cash hours.
Fusion rule
All gates are hard conditions rather than weighted scores. A trade can only open if the session window is active and the full gap condition is true. The gap distance engine only activates if a valid reference close exists and use_gap_risk is on. TP and SL are controlled by separate booleans so you can use SL only, TP only, or both. Long and short are symmetric by construction: long trades fade full gap downs, short trades fade full gap ups with mirrored TP and SL logic.
Signal rule
• Long entry. Inside the active session, when the current bar shows a full gap down relative to the previous bar (current high below prior low), the strategy opens a long position. If the gap risk engine is active, it places a gap based stop below the entry and an optional target above it.
• Short entry. Inside the active session, when the current bar shows a full gap up relative to the previous bar (current low above prior high), the strategy opens a short position. If the gap risk engine is active, it places a gap based stop above the entry and an optional target below it.
• Forced flat. At the configured flat time before session end, any open position is closed and the close price of that bar becomes the new reference close for the following session.
• Candle based exit. If enabled, a bearish bar closes longs, and a bullish bar closes shorts, regardless of where TP or SL sit, as long as a position is open.
What you will see on the chart
• Markers on entry bars. Standard strategy entry markers labeled “long” and “short” on the gap bars where trades open.
• Exit markers. Standard exit markers on bars where either the gap stop or target are hit, or where a candle exit or forced flat close occurs. Exit IDs “long_gap” and “short_gap” label gap based exits.
• Reference levels. Horizontal lines for the current long TP, long SL, short TP, and short SL while a position is open and the gap engine is enabled. They update when a new trade opens and disappear when flat.
• Session background. This version does not add background shading for the session; session logic runs internally based on time.
• No on chart table. All decisions are visible through orders and exit levels. Use the Strategy Tester for performance metrics.
Inputs with guidance
Session Settings
• Trading session (sess). Session window in exchange time. Typical value uses the regular cash session for each contract, for example “0830-1530” for ES. Adjust if your broker or symbol uses different hours.
• Minutes before session end to force exit (flat_before_min). Minutes before the session end where positions are forced flat and the reference close is stored. Typical range is 15 to 120. Raising it closes trades earlier in the day; lowering it allows trades later in the session.
Gap Risk
• Enable gap based TP/SL (use_gap_risk). Master switch for the gap distance exit engine. Turning it off keeps entries and forced flat logic but removes automatic TP and SL placement.
• Use TP limit from gap (use_gap_tp). Enables gap based profit targets. Typical values are true for structured exits or false if you want to manage exits manually and only keep a stop.
• Use SL stop from gap (use_gap_sl). Enables gap based stop losses. This should normally remain true so that each trade has a defined initial risk in ticks.
• TP multiplier of gap distance (tp_mult). Multiplier applied to the gap distance for the target. Typical range is 0.5 to 2.0. Raising it places the target further away and reduces hit frequency.
• SL multiplier of gap distance (sl_mult). Multiplier applied to the gap distance for the stop. Typical range is 0.5 to 2.0. Raising it widens the stop and increases risk per trade; lowering it tightens the stop and may increase the number of small losses.
Exit Controls
• Exit with candle logic (use_candle_exit). If true, closes shorts on bullish candles and longs on bearish candles. Useful when you want to react to intraday reversal bars even if TP or SL have not been reached.
• Force flat before session end (use_forced_flat). If true, guarantees you are flat by the configured flat time and updates the reference close. Turn this off only if you understand the impact on overnight risk.
Filters
There is no separate trend or volatility filter in this version. All trades depend on the presence of a full gap bar inside the session. If you need extra filtering such as ATR, volume, or higher timeframe bias, they should be added explicitly and documented in your own fork.
Usage recipes
Intraday conservative gap fade
• Timeframe. Five minute chart on ES regular session.
• Gap risk. use_gap_risk = true, use_gap_tp = true, use_gap_sl = true.
• Multipliers. tp_mult around 0.7 to 1.0 and sl_mult around 1.0.
• Exits. use_candle_exit = false, use_forced_flat = true. Focus on the structured TP and SL around the gap.
Intraday aggressive gap fade
• Timeframe. Five minute chart.
• Gap risk. use_gap_risk = true, use_gap_tp = false, use_gap_sl = true.
• Multipliers. sl_mult around 0.7 to 1.0.
• Exits. use_candle_exit = true, use_forced_flat = true. Entries fade full gaps, stops are tight, and candle color flips flatten trades early.
Higher timeframe gap tests
• Timeframe. Fifteen minute or sixty minute charts on instruments with regular gaps.
• Gap risk. Keep use_gap_risk = true. Consider slightly higher sl_mult if gaps are structurally wider on the higher timeframe.
• Note. Expect fewer trades and be careful with sample size; multi year data is recommended.
Properties visible in this publication
• On average our risk for each position over the last 200 trades is 0.4% with a max intraday loss of 1.5% of the total equity in this case of 100k $ with 1 contract ES. For other assets, recalculations and customizations has to be applied.
• Initial capital. 100 000.
• Base currency. USD.
• Default order size method. Fixed with size 1 contract.
• Pyramiding. 0.
• Commission. Flat 2 USD per order in the Strategy Tester Properties. (2$ buying + 2$selling)
• Slippage. One tick in the Strategy Tester Properties.
• Process orders on close. ON.
Realism and responsible publication
• No performance claims are made. Past results do not guarantee future outcomes.
• Costs use a realistic flat commission and one tick of slippage per trade for ES class futures.
• Default sizing with one contract on a 100 000 reference account targets modest per trade risk. In practice, extreme slippage or gap through events can exceed this, so treat the one and a half percent risk target as a design goal, not a guarantee.
• All orders are simulated on standard candles. Shapes can move while a bar is forming and settle on bar close.
Honest limitations and failure modes
• Economic releases, thin liquidity, and limit conditions can break the assumptions behind the simple gap model and lead to slippage or skipped fills.
• Symbols with very frequent or very large gaps may require adjusted multipliers or alternative risk handling, especially in high volatility regimes.
• Very quiet periods without clean gaps will produce few or no trades. This is expected behavior, not a bug.
• Session windows follow the exchange time of the chart. Always confirm that the configured session matches the symbol.
• When both the stop and target lie inside the same bar’s range, the TradingView engine decides which is hit first based on its internal intrabar assumptions. Without bar magnifier, tie handling is approximate.
Legal
Education and research only. This strategy is not investment advice. You remain responsible for all trading decisions. Always test on historical data and in simulation with realistic costs before considering any live use.
Cari dalam skrip untuk "stop loss"

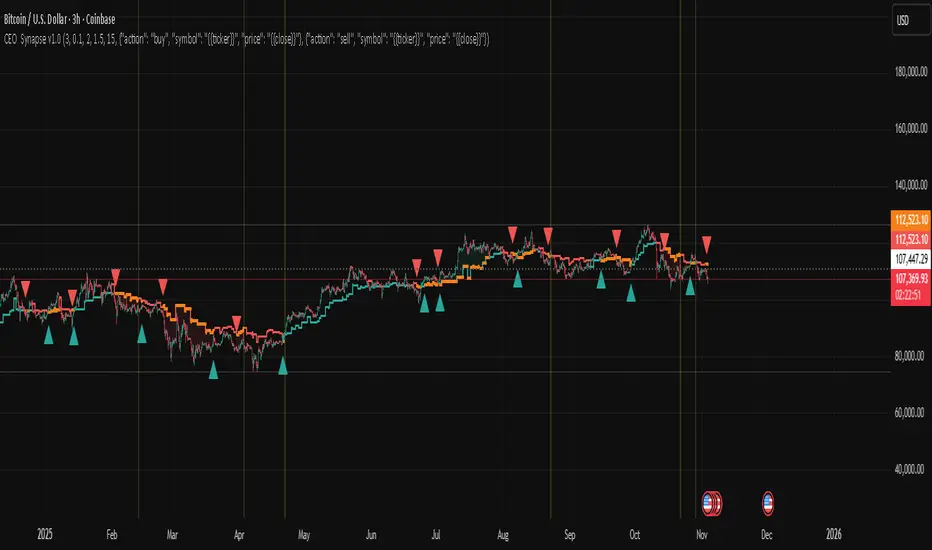
CEO Synapse v1.0CEO Synapse — Uyarlanabilir Rejim Stratejisi
This script is invite-only.
What Does This Strategy Do?
Markets are complex systems requiring various expertise. The "CEO Synapse" strategy adopts a "digital dashboard" approach based on the reality that a single viewpoint is insufficient. The strategy combines multiple analytical engines, each developed by me, analyzing different aspects of the market (structure, momentum, rhythm). It detects trend and momentum deviations in markets. A trading decision is made only when there is consensus among these expert engines. The "Synapse Engine" uses adaptive filtering and consensus logic for position management based on market regime (trend/range).
It eliminates the problem of traditional indicators generating misleading signals alone and failing to adapt to volatility and regime changes. Its dynamic threshold mechanism, adaptive periods, and special noise filters reduce unnecessary trades.
Original Methodology and Proprietary Logic: This algorithm does not rely on or copy any open source strategy code. The system uses commonly accepted indicators' mathematical principles such as ADX, EMA, SMA, ATR, True Range, etc., as data sources. The author's methodology combines dynamic period EMA, multi-filter consensus, adaptive threshold, and regime-based execution.
Though our strategy creates an original decision-making mechanism, it leverages foundational building blocks of technical analysis. The traditional indicators we use and their purposes are:
ADX (Average Directional Index): This indicator measures a trend’s strength, not its direction. Our strategy uses ADX as a filter to open positions only under sufficiently strong and distinct trend market conditions. This largely prevents misleading signals in weak or sideways markets.
Moving Averages (EMA and SMA): They form the backbone to determine the main trend direction. By smoothing price data, they reduce noise and reveal the market's general trend. But our strategy processes their outputs not as traditional crossover signals, but as input to an advanced consensus logic with dynamically adjusted periods based on market rhythm combined with other filters.
ATR (Average True Range): This indicator does not produce direct buy-sell signals but measures current market volatility. Especially in "Sideways Market" regime, take profit and stop loss levels are dynamically set based on ATR instead of fixed values, enabling risk management to adapt to market conditions.
Bollinger Band Logic (using Standard Deviation): Though the strategy does not plot Bollinger Bands directly, it uses Standard Deviation, the underlying mathematical concept, to detect excessive price deviations and volatility spikes, producing critical signals for the AMF PG core engine.
"Synapse Engine" consists of two layers: Decision Center (Dynamic Threshold) which automatically adjusts risk appetite based on performance and regime; and Filter Committee (Consensus Score) which weights separate filters to produce a single score. This combination is not reproducible and commercially valuable. Closed source is mandatory.
No classic open source code used. Only publicly available indicators are used. Parameters, order, and usage are fully customized.
Generated Signals: Trend/range entry/exit (long/short), adaptive trailing stop position management, additional risk control signals with Shock Absorber and Quantum Filter.
Purpose: Detect trend breaks and momentum deviations. Components: Volatility filters, adaptive signal weighting, EMA/SMA. Methodology: Combines price and volume change rates via dynamic weighting functions.
What Problem Does CEO Synapse Solve?
CEO Synapse addresses three main issues caused by traditional technical analysis and single indicator usage:
Problem: Misleading Signals and Market Noise
Traditional indicators (MACD, RSI, etc.) generate many "false" buy-sell signals, especially in sideways and choppy markets, causing traders to constantly enter and exit positions (whipsaw) and incur losses.
CEO Synapse Solution: The strategy never relies on a single signal. The Consensus-Based Decision Mechanism ensures no position is opened unless different analytical engines (structural, momentum, rhythm) agree. This "board of directors" approach filters market noise, processing only high-probability signals.
Problem: Static Analysis and Changing Market Conditions
Markets constantly change character; sometimes strong trend, sometimes narrow range. Most strategies try to function with fixed parameters across all conditions, leading to failure.
CEO Synapse Solution: The strategy has Adaptive Regime Switching. It actively analyzes whether the market is in "Trend Mode" or "Sideways Market Mode" and automatically adjusts entry/exit rules and risk management (take profit/stop loss) to the current regime, allowing chameleon-like adaptation to conditions.
Problem: Fixed Parameters and Declining Performance
Many traders believe they find the "best" settings and never change them for months or years. But as market volatility and cycles change, fixed settings lose effectiveness.
CEO Synapse Solution: The strategy operates on Full Adaptation principle.
Market Rhythm Adaptation: Dynamically adjusts analysis speed (e.g., EMA periods) according to market’s natural cycles.
Performance Adaptation: Continuously optimizes risk appetite (signal threshold) based on recent strategy performance, becoming bolder with gains and more cautious with losses.
In summary, CEO Synapse simplifies decision-making, eliminates market noise, and smartly adapts to changing market conditions, protecting the user from common mistakes.
Why "Invite-Only"?
Offering CEO Synapse as "Invite-Only" is a strategic decision to protect the strategy's commercial value and intellectual property and to provide users with the highest quality experience. Key reasons:
Protection of Proprietary IP:
CEO Synapse is the result of hundreds of hours of research, development, and testing. Its consensus logic, adaptive threshold mechanism, and engine integration are unique and patented. Open sourcing it would instantly destroy this trade secret and competitive edge.
Maintaining Performance Integrity and Effectiveness:
Uncontrolled distribution could lead to misuse or signal theft and sale by malicious actors. The invite-only model preserves the strategy’s integrity and ensures access only for serious investors.
Quality User Experience and Support:
Controlled distribution allows better user experience. High-quality documentation explaining features and best practices can be provided, and future updates and support services can be managed better for a limited user base.
Business Model:
CEO Synapse is positioned as a premium analysis tool. Invite-only access reflects its value and compensates the developer for ongoing maintenance, support, and future improvements.
Usage: Available on all timeframes.
Based entirely on my own adaptive filtering methodology.
Proprietary logic: The algorithm’s unique, non-reproducible logic and methodology. Example: Multi-filter consensus + adaptive threshold + regime-based execution.
Why Is This a Premium Tool?
"CEO Synapse"’s value stems from being a proprietary, integrated system beyond free standard indicators:
Advanced Noise Filtering: Not just reduces noise but adjusts filter sensitivity to current market character. Inspired by public mathematical concepts (cycle analysis, statistical filtering) but uniquely combined with proprietary weighting mechanisms and adaptive consensus logic forming the strategy's commercial value. Core indicators (EMA, ATR, ADX, DMI, etc.) are uniquely processed inside this proprietary system.
Full Adaptation: Instead of fixed parameters, the strategy continuously adapts to the market's natural rhythm, volatility, and past performance.
Consensus-Based Decision Making: Relies on collective intelligence of multiple analytical engines, not a single failure point.
These features substantially increase the ability to extract meaningful, actionable insights from raw market data, making it premium. It improves signal accuracy, reduces risk, and adapts to regime shifts. The dynamic threshold mechanism continuously adjusts risk appetite based on recent performance (profitability) and market regime.
By using this script, you agree not to redistribute, sell, or reverse engineer the source code.
This strategy is for educational purposes only. Past performance does not guarantee future results. Always apply proper risk management and protect your capital.
Risk Management: Maximum Drawdown Protection
The strategy includes a built-in capital protection mechanism. Users can specify the percentage drop from peak capital they tolerate. If the capital hits this drawdown limit, protection activates, closing all open positions and blocking new trades, acting as an emergency brake to guard capital against unexpected market conditions.
Automation Ready: Customizable Webhook Alerts
Fully Compatible Automation (JSON): The strategy outputs fully configurable JSON-formatted alert messages for buy, sell, and close actions. This allows connecting CEO Synapse signals to automation platforms like 3Commas and PineConnector for fully automated trading. Dynamic values like position size ({{strategy.order.contracts}}) are automatically included in alerts.
Strategy Backtest Information
Please remember past performance is not indicative of future results. The published chart and report are based on the BTCUSD pair in a 3-hour timeframe with the following settings:
Test Period: January 1, 2018 – November 3, 2025
Default Position Size: 15% of capital
Pyramiding: Off
Commission: 0.0008
Slippage: 2 ticks
Test Approach: The published test contains 201 trades and is statistically significant. Performing your own tests on different assets and timeframes is strongly recommended. Default settings are a template and should be adjusted per your analysis.
U.T.M.S v2🇷🇺 ОПИСАНИЕ (РУССКИЙ)
U.T.M.S v2 — Чистый EMA-кроссовер с фильтрами
Стратегия для 15м (в первую очередь) и 1ч таймфреймов.
Генерирует сигналы при пересечении EMA(8) и EMA(19) только при подтверждении тренда, объёма, волатильности и времени суток.
Каждая сделка закрывается по фиксированному Take Profit и Stop Loss.
✅ Минимум ложных входов
✅ Работает только в ликвидные часы
✅ Полная фильтрация шума и флэта
🔧 Настройки:
Fast EMA / Slow EMA — периоды скользящих (по умолчанию 8 / 19)
Take Profit % — уровень фиксации прибыли (рек. 2.5%)
Stop Loss % — уровень стоп-лосса (рек. 2.0%)
Фильтры (все включены по умолчанию):
Use 1H Trend Filter — вход разрешён только по направлению тренда на 1H (EMA50 > EMA200 для лонга)
Use Volume Filter — объём должен быть ≥ 1.5× среднего за 20 баров
Min Volume Multiplier — нижний порог объёма (рек. 1.5)
Max Volume Multiplier — верхний порог (рек. 3.0–4.0), отсекает аномальные пампы
Use ATR Volatility Filter — минимальная волатильность (рек. 0.3%)
Use Time Filter (UTC) — торговля только в часы высокой ликвидности: 12:00–18:00 и 20:00–02:00 UTC
💡 Идеальна для ручной торговли или подключения сигнальных ботов.
🇬🇧 DESCRIPTION (ENGLISH)
U.T.M.S v2 — Clean EMA Crossover with Filters
Strategy for 15m (primarily) and 1h timeframes.
Generates signals when the EMA(8) and EMA(19) cross, only if trend, volume, volatility, and time of day are confirmed.
Each trade is closed with a fixed Take Profit and Stop Loss.
✅ Low noise, high-quality signals
✅ Active only during high-liquidity hours
✅ Fully protected against flat and fakeouts
🔧 Inputs:
Fast EMA / Slow EMA — moving average periods (default: 8 / 19)
Take Profit % — profit target (suggested: 2.5%)
Stop Loss % — stop loss level (suggested: 2.0%)
Filters (all enabled by default):
Use 1H Trend Filter — trades only in 1H trend direction (EMA50 > EMA200 for long)
Use Volume Filter — volume must be ≥ 1.5× 20-bar average
Min Volume Multiplier — minimum volume threshold (suggested: 1.5)
Max Volume Multiplier — maximum volume cap (suggested: 3.0–4.0), filters out pumps/dumps
Use ATR Volatility Filter — minimum volatility (suggested: 0.3%)
Use Time Filter (UTC) — active only during high-liquidity sessions: 12:00–18:00 & 20:00–02:00 UTC
💡 Perfect for manual trading or webhook-based signal bots.

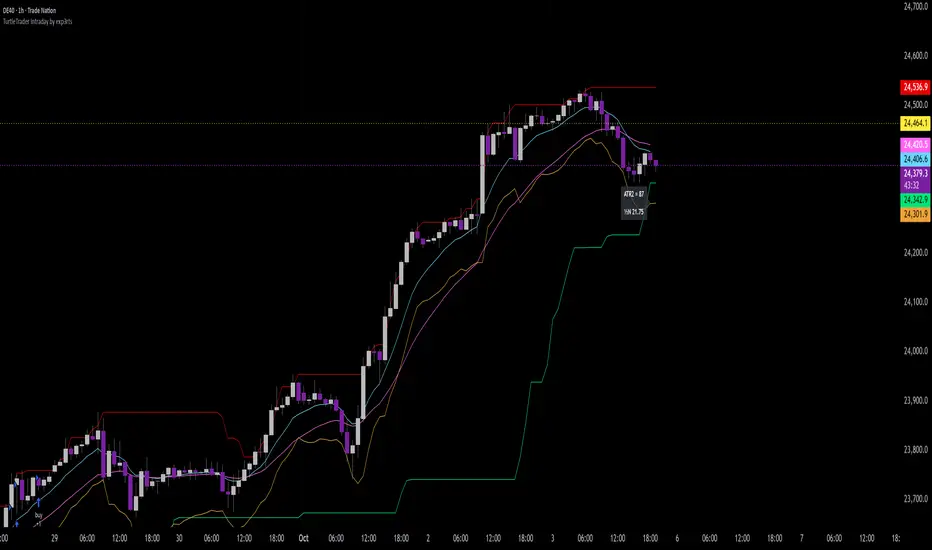
TurtleTrader Intraday Extended by exp3rts🐢 TurtleTrader Intraday Extended by exp3rts
A modern intraday adaptation of the classic Turtle Trading strategy, optimized for short-term breakout trading with built-in risk management, pyramiding, and optional trend filters.
This strategy captures strong directional moves by entering breakouts from price channels, using ATR-based stop losses and controlled position scaling.
🔑 Key Features:
📈 Channel Breakout Entries: Buy/sell on breakout of highest highs or lowest lows
🛑 Dynamic ATR Stop Loss: Automatically calculated from market volatility
🔁 Pyramiding: Adds up to 4 positions as price moves in your favor
🔄 Directional Mode: Choose Long-only or Short-only mode
🧠 Skip After Win Option: Avoid overtrading by skipping the next entry after a profitable trade
📊 Optional EMA Display: Plot up to 3 EMAs for trend filtering or visual confirmation
📉 On-Chart ATR Label: Displays real-time ATR metrics (including ½N size used in classic Turtle rules)
⚙️ Strategy Inputs:
Entry/Exit channel length
ATR multiplier and period
Entry delay (bar offset)
Optional trade filter after profitable trades
Show/hide EMAs and ATR label
🧪 Best For:
Intraday breakout traders (works well on 5m–1h timeframes)
Traders who prefer mechanical rules and structured risk
Anyone testing volatility-based entries and exits
Inspired by the original Turtle Trading system — redesigned for modern markets with more intraday flexibility and visual enhancements.
RSI Momentum ScalperOverview
The "RSI Momentum Scalper" is a Pine Script v5 strategy crafted for trading highly volatile markets, with a special focus on newly listed cryptocurrencies. This strategy harnesses the Relative Strength Index (RSI) alongside volume analysis and momentum thresholds to pinpoint short-term trading opportunities. It supports both long and short trades, managed with customizable take profit, stop loss, and trailing stop levels, which are visually plotted on the chart for easy tracking.
Why I Created This Strategy
I developed the "RSI Momentum Scalper" because I was seeking a reliable trading strategy tailored to newly listed, highly volatile cryptocurrencies. These assets often experience rapid price fluctuations, rendering traditional strategies less effective. I aimed to create a tool that could exploit momentum and volume spikes while managing risk through adaptable exit parameters. This strategy is designed to address that need, offering a flexible approach for traders in dynamic crypto markets.
How It Works
The strategy utilizes RSI to identify momentum shifts, combined with volume confirmation, to trigger long or short entries. Trades are controlled with take profit, stop loss, and trailing stop levels, which adjust dynamically as the price moves in your favor. The trailing stop helps lock in profits, while the plotted exit levels provide clear visual cues for trade management.
Customizable Settings
The script is highly customizable, allowing you to adjust it to various market conditions and trading styles. Here’s a brief overview of the key settings:
Trade Mode: Select "Both," "Long Only," or "Short Only" to determine the trade direction.
(Default: Both)
RSI Length: Sets the lookback period for the RSI calculation (2 to 30).
(Default: 8)
A shorter length increases RSI sensitivity, suitable for volatile assets.
RSI Overbought: Defines the upper RSI threshold (60 to 99) for short entries.
(Default: 90)
Higher values signal stronger overbought conditions.
RSI Oversold: Defines the lower RSI threshold (1 to 40) for long entries.
(Default: 10)
Lower values indicate stronger oversold conditions.
RSI Momentum Threshold: Sets the minimum RSI momentum change (1 to 15) to trigger entries.
(Default: 14)
Adjusts the sensitivity to price momentum.
Volume Multiplier: Multiplies the volume moving average to filter high-volume bars (1.0 to 3.0).
(Default: 1)
Higher values require stronger volume confirmation.
Volume MA Length: Sets the lookback period for the volume moving average (5 to 50).
(Default: 13)
Influences the volume trend sensitivity.
Take Profit %: Sets the profit target as a percentage of the entry price (0.1 to 10.0).
(Default: 4.15)
Determines when to close a winning trade.
Stop Loss %: Sets the loss limit as a percentage of the entry price (0.1 to 6.0).
(Default: 1.85)
Protects against significant losses.
Trailing Stop %: Sets the trailing stop distance as a percentage (0.1 to 4.0).
(Default: 2.55)
Locks in profits as the price moves favorably.
Visual Features
Exit Levels: Take profit (green), fixed stop loss (red), and trailing stop (orange) levels are plotted when in a position.
Performance Table: Displays win rate, total trades, and net profit in the top-right corner.
How to Use
Add the strategy to your chart in TradingView.
Adjust the input settings based on the cryptocurrency and timeframe you’re trading.
Monitor the plotted exit levels for trade management.
Use the performance table to assess the strategy’s performance over time.
Notes
Test the strategy on a demo account or with historical data before live trading.
The strategy is optimized for short-term scalping; adjust settings for longer timeframes if needed.

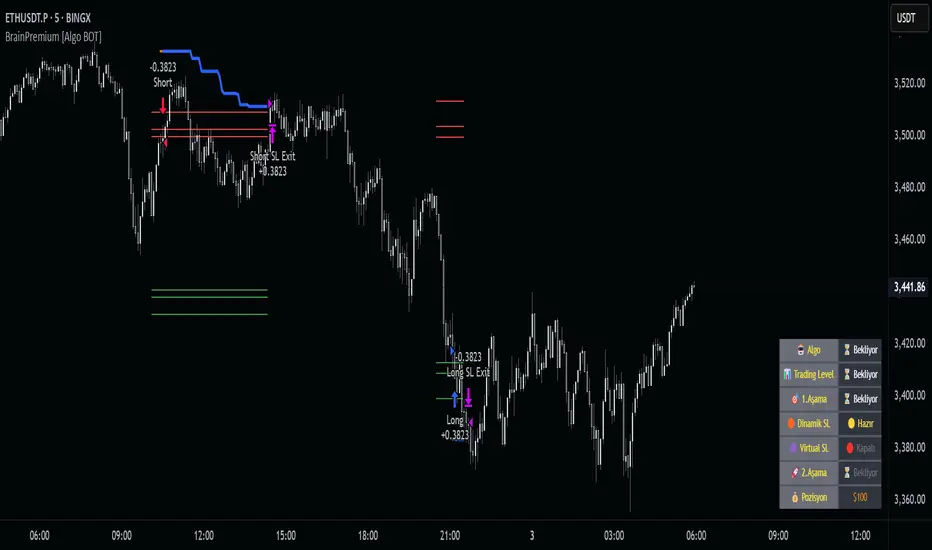
Brain Premium [ALGO]💡 Brain Premium ALGO
Brainpremium ALGO is a strategy algorithm that analyzes a two-phase regional liquidity structure and only opens positions on price breakouts occurring within these liquidity zones.
This system is developed based on the market experience of manual traders and automatically executes trade decisions using AI-like rules and specific triggers.
💡 Two-Phase Liquidity-Based Entry Strategy
This strategy operates by detecting liquidity sweep zones and confirmed reversal signals:
🔹 Phase 1 – Liquidity Sweep:
Price is expected to sweep areas where equal highs/lows or liquidity clusters exist. These zones are considered potential reversal levels.
🔹 Phase 2 – Confirmed Entry:
After liquidity is swept, entries are triggered only by confirmed reversal signals such as structural breaks, inside bars, or breakouts in the opposite direction.
✅ Entries are triggered only when liquidity and reversal confirmation occur simultaneously.
🎯 This approach targets high-probability, low-risk trades.
⚙️ Key Features
🔍 Dynamic Liquidity Detection — Automatically identifies liquidity zones.
🧩 Modular Entry Options (1–2–3) — Allows opening positions via different strategy paths.
🛡️ Dynamic Stop Loss System — Stop Loss adjusts as price moves favorably.
📈 Advanced Risk Management — Adjustable Take Profit, Stop Loss, leverage, balance, and mode.
🔔 JSON Alert Support — Connects to platforms like BingX via webhook.
🧾 Information Panel — Displays real-time trade data and strategy status.
📊 Backtest & Default Settings
Strategy tests are conducted with realistic and sustainable parameters:
Parameter Value
Trading Balance: $100 (%10 of total wallet)
Leverage: 10x
Stop Loss: 1%
Take Profit Type : High TP (optional: Low and Risky also available)
Entry Option 1 (optional: 2 and 3 also available)
Mode: NORMAL
Commission 0.05%
Dynamic Stop Loss: Enabled
Timeframe: 5 minute
Pair ETH/USDT
Duration: 30 days
🧭 Usage Instructions
Add Brain Premium ALGO to your TradingView chart.
Set position size, leverage, and SL/TP levels from the settings panel.
Select entry option (1, 2, or 3).
Activate backtesting and alert systems to monitor the strategy.
⚠️ Disclaimer
This strategy is not financial advice. Past performance does not guarantee future results. Trade only with capital you can afford to risk and always test thoroughly in a demo environment first.
Bober XM v2.0# ₿ober XM v2.0 Trading Bot Documentation
**Developer's Note**: While our previous Bot 1.3.1 was removed due to guideline violations, this setback only fueled our determination to create something even better. Rising from this challenge, Bober XM 2.0 emerges not just as an update, but as a complete reimagining with multi-timeframe analysis, enhanced filters, and superior adaptability. This adversity pushed us to innovate further and deliver a strategy that's smarter, more agile, and more powerful than ever before. Challenges create opportunity - welcome to Cryptobeat's finest work yet.
## !!!!You need to tune it for your own pair and timeframe and retune it periodicaly!!!!!
## Overview
The ₿ober XM v2.0 is an advanced dual-channel trading bot with multi-timeframe analysis capabilities. It integrates multiple technical indicators, customizable risk management, and advanced order execution via webhook for automated trading. The bot's distinctive feature is its separate channel systems for long and short positions, allowing for asymmetric trade strategies that adapt to different market conditions across multiple timeframes.
### Key Features
- **Multi-Timeframe Analysis**: Analyze price data across multiple timeframes simultaneously
- **Dual Channel System**: Separate parameter sets for long and short positions
- **Advanced Entry Filters**: RSI, Volatility, Volume, Bollinger Bands, and KEMAD filters
- **Machine Learning Moving Average**: Adaptive prediction-based channels
- **Multiple Entry Strategies**: Breakout, Pullback, and Mean Reversion modes
- **Risk Management**: Customizable stop-loss, take-profit, and trailing stop settings
- **Webhook Integration**: Compatible with external trading bots and platforms
### Strategy Components
| Component | Description |
|---------|-------------|
| **Dual Channel Trading** | Uses either Keltner Channels or Machine Learning Moving Average (MLMA) with separate settings for long and short positions |
| **MLMA Implementation** | Machine learning algorithm that predicts future price movements and creates adaptive bands |
| **Pivot Point SuperTrend** | Trend identification and confirmation system based on pivot points |
| **Three Entry Strategies** | Choose between Breakout, Pullback, or Mean Reversion approaches |
| **Advanced Filter System** | Multiple customizable filters with multi-timeframe support to avoid false signals |
| **Custom Exit Logic** | Exits based on OBV crossover of its moving average combined with pivot trend changes |
### Note for Novice Users
This is a fully featured real trading bot and can be tweaked for any ticker — SOL is just an example. It follows this structure:
1. **Indicator** – gives the initial signal
2. **Entry strategy** – decides when to open a trade
3. **Exit strategy** – defines when to close it
4. **Trend confirmation** – ensures the trade follows the market direction
5. **Filters** – cuts out noise and avoids weak setups
6. **Risk management** – controls losses and protects your capital
To tune it for a different pair, you'll need to start from scratch:
1. Select the timeframe (candle size)
2. Turn off all filters and trend entry/exit confirmations
3. Choose a channel type, channel source and entry strategy
4. Adjust risk parameters
5. Tune long and short settings for the channel
6. Fine-tune the Pivot Point Supertrend and Main Exit condition OBV
This will generate a lot of signals and activity on the chart. Your next task is to find the right combination of filters and settings to reduce noise and tune it for profitability.
### Default Strategy values
Default values are tuned for: Symbol BITGET:SOLUSDT.P 5min candle
Filters are off by default: Try to play with it to understand how it works
## Configuration Guide
### General Settings
| Setting | Description | Default Value |
|---------|-------------|---------------|
| **Long Positions** | Enable or disable long trades | Enabled |
| **Short Positions** | Enable or disable short trades | Enabled |
| **Risk/Reward Area** | Visual display of stop-loss and take-profit zones | Enabled |
| **Long Entry Source** | Price data used for long entry signals | hl2 (High+Low/2) |
| **Short Entry Source** | Price data used for short entry signals | hl2 (High+Low/2) |
The bot allows you to trade long positions, short positions, or both simultaneously. Each direction has its own set of parameters, allowing for fine-tuned strategies that recognize the asymmetric nature of market movements.
### Multi-Timeframe Settings
1. **Enable Multi-Timeframe Analysis**: Toggle 'Enable Multi-Timeframe Analysis' in the Multi-Timeframe Settings section
2. **Configure Timeframes**: Set appropriate higher timeframes based on your trading style:
- Timeframe 1: Default is now 15 minutes (intraday confirmation)
- Timeframe 2: Default is 4 hours (trend direction)
3. **Select Sources per Indicator**: For each indicator (RSI, KEMAD, Volume, etc.), choose:
- The desired timeframe (current, mtf1, or mtf2)
- The appropriate price type (open, high, low, close, hl2, hlc3, ohlc4)
### Entry Strategies
- **Breakout**: Enter when price breaks above/below the channel
- **Pullback**: Enter when price pulls back to the channel
- **Mean Reversion**: Enter when price is extended from the channel
You can enable different strategies for long and short positions.
### Core Components
### Risk Management
- **Position Size**: Control risk with percentage-based position sizing
- **Stop Loss Options**:
- Fixed: Set a specific price or percentage from entry
- ATR-based: Dynamic stop-loss based on market volatility
- Swing: Uses recent swing high/low points
- **Take Profit**: Multiple targets with percentage allocation
- **Trailing Stop**: Dynamic stop that follows price movement
## Advanced Usage Strategies
### Moving Average Type Selection Guide
- **SMA**: More stable in choppy markets, good for higher timeframes
- **EMA/WMA**: More responsive to recent price changes, better for entry signals
- **VWMA**: Adds volume weighting for stronger trends, use with Volume filter
- **HMA**: Balance between responsiveness and noise reduction, good for volatile markets
### Multi-Timeframe Strategy Approaches
- **Trend Confirmation**: Use higher timeframe RSI (mtf2) for overall trend, current timeframe for entries
- **Entry Precision**: Use KEMAD on current timeframe with volume filter on mtf1
- **False Signal Reduction**: Apply RSI filter on mtf1 with strict KEMAD settings
### Market Condition Optimization
| Market Condition | Recommended Settings |
|------------------|----------------------|
| **Trending** | Use Breakout strategy with KEMAD filter on higher timeframe |
| **Ranging** | Use Mean Reversion with strict RSI filter (mtf1) |
| **Volatile** | Increase ATR multipliers, use HMA for moving averages |
| **Low Volatility** | Decrease noise parameters, use pullback strategy |
## Webhook Integration
The strategy features a professional webhook system that allows direct connectivity to your exchange or trading platform of choice through third-party services like 3commas, Alertatron, or Autoview.
The webhook payload includes all necessary parameters for automated execution:
- Entry price and direction
- Stop loss and take profit levels
- Position size
- Custom identifier for webhook routing
## Performance Optimization Tips
1. **Start with Defaults**: Begin with the default settings for your timeframe before customizing
2. **Adjust One Component at a Time**: Make incremental changes and test the impact
3. **Match MA Types to Market Conditions**: Use appropriate moving average types based on the Market Condition Optimization table
4. **Timeframe Synergy**: Create logical relationships between timeframes (e.g., 5min chart with 15min and 4h higher timeframes)
5. **Periodic Retuning**: Markets evolve - regularly review and adjust parameters
## Common Setups
### Crypto Trend-Following
- MLMA with EMA or HMA
- Higher RSI thresholds (75/25)
- KEMAD filter on mtf1
- Breakout entry strategy
### Stock Swing Trading
- MLMA with SMA for stability
- Volume filter with higher threshold
- KEMAD with increased filter order
- Pullback entry strategy
### Forex Scalping
- MLMA with WMA and lower noise parameter
- RSI filter on current timeframe
- Use highest timeframe for trend direction only
- Mean Reversion strategy
## Webhook Configuration
- **Benefits**:
- Automated trade execution without manual intervention
- Immediate response to market conditions
- Consistent execution of your strategy
- **Implementation Notes**:
- Requires proper webhook configuration on your exchange or platform
- Test thoroughly with small position sizes before full deployment
- Consider latency between signal generation and execution
### Backtesting Period
Define a specific historical period to evaluate the bot's performance:
| Setting | Description | Default Value |
|---------|-------------|---------------|
| **Start Date** | Beginning of backtest period | January 1, 2025 |
| **End Date** | End of backtest period | December 31, 2026 |
- **Best Practice**: Test across different market conditions (bull markets, bear markets, sideways markets)
- **Limitation**: Past performance doesn't guarantee future results
## Entry and Exit Strategies
### Dual-Channel System
A key innovation of the Bober XM is its dual-channel approach:
- **Independent Parameters**: Each trade direction has its own channel settings
- **Asymmetric Trading**: Recognizes that markets often behave differently in uptrends versus downtrends
- **Optimized Performance**: Fine-tune settings for both bullish and bearish conditions
This approach allows the bot to adapt to the natural asymmetry of markets, where uptrends often develop gradually while downtrends can be sharp and sudden.
### Channel Types
#### 1. Keltner Channels
Traditional volatility-based channels using EMA and ATR:
| Setting | Long Default | Short Default |
|---------|--------------|---------------|
| **EMA Length** | 37 | 20 |
| **ATR Length** | 13 | 17 |
| **Multiplier** | 1.4 | 1.9 |
| **Source** | low | high |
- **Strengths**:
- Reliable in trending markets
- Less prone to whipsaws than Bollinger Bands
- Clear visual representation of volatility
- **Weaknesses**:
- Can lag during rapid market changes
- Less effective in choppy, non-trending markets
#### 2. Machine Learning Moving Average (MLMA)
Advanced predictive model using kernel regression (RBF kernel):
| Setting | Description | Options |
|---------|-------------|--------|
| **Source MA** | Price data used for MA calculations | Any price source (low/high/close/etc.) |
| **Moving Average Type** | Type of MA algorithm for calculations | SMA, EMA, WMA, VWMA, RMA, HMA |
| **Trend Source** | Price data used for trend determination | Any price source (close default) |
| **Window Size** | Historical window for MLMA calculations | 5+ (default: 16) |
| **Forecast Length** | Number of bars to forecast ahead | 1+ (default: 3) |
| **Noise Parameter** | Controls smoothness of prediction | 0.01+ (default: ~0.43) |
| **Band Multiplier** | Multiplier for channel width | 0.1+ (default: 0.5-0.6) |
- **Strengths**:
- Predictive rather than reactive
- Adapts quickly to changing market conditions
- Better at identifying trend reversals early
- **Weaknesses**:
- More computationally intensive
- Requires careful parameter tuning
- Can be sensitive to input data quality
### Entry Strategies
| Strategy | Description | Ideal Market Conditions |
|----------|-------------|-------------------------|
| **Breakout** | Enters when price breaks through channel bands, indicating strong momentum | High volatility, emerging trends |
| **Pullback** | Enters when price retraces to the middle band after testing extremes | Established trends with regular pullbacks |
| **Mean Reversion** | Enters at channel extremes, betting on a return to the mean | Range-bound or oscillating markets |
#### Breakout Strategy (Default)
- **Implementation**: Enters long when price crosses above the upper band, short when price crosses below the lower band
- **Strengths**: Captures strong momentum moves, performs well in trending markets
- **Weaknesses**: Can lead to late entries, higher risk of false breakouts
- **Optimization Tips**:
- Increase channel multiplier for fewer but more reliable signals
- Combine with volume confirmation for better accuracy
#### Pullback Strategy
- **Implementation**: Enters long when price pulls back to middle band during uptrend, short during downtrend pullbacks
- **Strengths**: Better entry prices, lower risk, higher probability setups
- **Weaknesses**: Misses some strong moves, requires clear trend identification
- **Optimization Tips**:
- Use with trend filters to confirm overall direction
- Adjust middle band calculation for market volatility
#### Mean Reversion Strategy
- **Implementation**: Enters long at lower band, short at upper band, expecting price to revert to the mean
- **Strengths**: Excellent entry prices, works well in ranging markets
- **Weaknesses**: Dangerous in strong trends, can lead to fighting the trend
- **Optimization Tips**:
- Implement strong trend filters to avoid counter-trend trades
- Use smaller position sizes due to higher risk nature
### Confirmation Indicators
#### Pivot Point SuperTrend
Combines pivot points with ATR-based SuperTrend for trend confirmation:
| Setting | Default Value |
|---------|---------------|
| **Pivot Period** | 25 |
| **ATR Factor** | 2.2 |
| **ATR Period** | 41 |
- **Function**: Identifies significant market turning points and confirms trend direction
- **Implementation**: Requires price to respect the SuperTrend line for trade confirmation
#### Weighted Moving Average (WMA)
Provides additional confirmation layer for entries:
| Setting | Default Value |
|---------|---------------|
| **Period** | 15 |
| **Source** | ohlc4 (average of Open, High, Low, Close) |
- **Function**: Confirms trend direction and filters out low-quality signals
- **Implementation**: Price must be above WMA for longs, below for shorts
### Exit Strategies
#### On-Balance Volume (OBV) Based Exits
Uses volume flow to identify potential reversals:
| Setting | Default Value |
|---------|---------------|
| **Source** | ohlc4 |
| **MA Type** | HMA (Options: SMA, EMA, WMA, RMA, VWMA, HMA) |
| **Period** | 22 |
- **Function**: Identifies divergences between price and volume to exit before reversals
- **Implementation**: Exits when OBV crosses its moving average in the opposite direction
- **Customizable MA Type**: Different MA types provide varying sensitivity to OBV changes:
- **SMA**: Traditional simple average, equal weight to all periods
- **EMA**: More weight to recent data, responds faster to price changes
- **WMA**: Weighted by recency, smoother than EMA
- **RMA**: Similar to EMA but smoother, reduces noise
- **VWMA**: Factors in volume, helpful for OBV confirmation
- **HMA**: Reduces lag while maintaining smoothness (default)
#### ADX Exit Confirmation
Uses Average Directional Index to confirm trend exhaustion:
| Setting | Default Value |
|---------|---------------|
| **ADX Threshold** | 35 |
| **ADX Smoothing** | 60 |
| **DI Length** | 60 |
- **Function**: Confirms trend weakness before exiting positions
- **Implementation**: Requires ADX to drop below threshold or DI lines to cross
## Filter System
### RSI Filter
- **Function**: Controls entries based on momentum conditions
- **Parameters**:
- Period: 15 (default)
- Overbought level: 71
- Oversold level: 23
- Multi-timeframe support: Current, MTF1 (15min), or MTF2 (4h)
- Customizable price source (open, high, low, close, hl2, hlc3, ohlc4)
- **Implementation**: Blocks long entries when RSI > overbought, short entries when RSI < oversold
### Volatility Filter
- **Function**: Prevents trading during excessive market volatility
- **Parameters**:
- Measure: ATR (Average True Range)
- Period: Customizable (default varies by timeframe)
- Threshold: Adjustable multiplier
- Multi-timeframe support
- Customizable price source
- **Implementation**: Blocks trades when current volatility exceeds threshold × average volatility
### Volume Filter
- **Function**: Ensures adequate market liquidity for trades
- **Parameters**:
- Threshold: 0.4× average (default)
- Measurement period: 5 (default)
- Moving average type: Customizable (HMA default)
- Multi-timeframe support
- Customizable price source
- **Implementation**: Requires current volume to exceed threshold × average volume
### Bollinger Bands Filter
- **Function**: Controls entries based on price relative to statistical boundaries
- **Parameters**:
- Period: Customizable
- Standard deviation multiplier: Adjustable
- Moving average type: Customizable
- Multi-timeframe support
- Customizable price source
- **Implementation**: Can require price to be within bands or breaking out of bands depending on strategy
### KEMAD Filter (Kalman EMA Distance)
- **Function**: Advanced trend confirmation using Kalman filter algorithm
- **Parameters**:
- Process Noise: 0.35 (controls smoothness)
- Measurement Noise: 24 (controls reactivity)
- Filter Order: 6 (higher = more smoothing)
- ATR Length: 8 (for bandwidth calculation)
- Upper Multiplier: 2.0 (for long signals)
- Lower Multiplier: 2.7 (for short signals)
- Multi-timeframe support
- Customizable visual indicators
- **Implementation**: Generates signals based on price position relative to Kalman-filtered EMA bands
## Risk Management System
### Position Sizing
Automatically calculates position size based on account equity and risk parameters:
| Setting | Default Value |
|---------|---------------|
| **Risk % of Equity** | 50% |
- **Implementation**:
- Position size = (Account equity × Risk %) ÷ (Entry price × Stop loss distance)
- Adjusts automatically based on volatility and stop placement
- **Best Practices**:
- Start with lower risk percentages (1-2%) until strategy is proven
- Consider reducing risk during high volatility periods
### Stop-Loss Methods
Multiple stop-loss calculation methods with separate configurations for long and short positions:
| Method | Description | Configuration |
|--------|-------------|---------------|
| **ATR-Based** | Dynamic stops based on volatility | ATR Period: 14, Multiplier: 2.0 |
| **Percentage** | Fixed percentage from entry | Long: 1.5%, Short: 1.5% |
| **PIP-Based** | Fixed currency unit distance | 10.0 pips |
- **Implementation Notes**:
- ATR-based stops adapt to changing market volatility
- Percentage stops maintain consistent risk exposure
- PIP-based stops provide precise control in stable markets
### Trailing Stops
Locks in profits by adjusting stop-loss levels as price moves favorably:
| Setting | Default Value |
|---------|---------------|
| **Stop-Loss %** | 1.5% |
| **Activation Threshold** | 2.1% |
| **Trailing Distance** | 1.4% |
- **Implementation**:
- Initial stop remains fixed until profit reaches activation threshold
- Once activated, stop follows price at specified distance
- Locks in profit while allowing room for normal price fluctuations
### Risk-Reward Parameters
Defines the relationship between risk and potential reward:
| Setting | Default Value |
|---------|---------------|
| **Risk-Reward Ratio** | 1.4 |
| **Take Profit %** | 2.4% |
| **Stop-Loss %** | 1.5% |
- **Implementation**:
- Take profit distance = Stop loss distance × Risk-reward ratio
- Higher ratios require fewer winning trades for profitability
- Lower ratios increase win rate but reduce average profit
### Filter Combinations
The strategy allows for simultaneous application of multiple filters:
- **Recommended Combinations**:
- Trending markets: RSI + KEMAD filters
- Ranging markets: Bollinger Bands + Volatility filters
- All markets: Volume filter as minimum requirement
- **Performance Impact**:
- Each additional filter reduces the number of trades
- Quality of remaining trades typically improves
- Optimal combination depends on market conditions and timeframe
### Multi-Timeframe Filter Applications
| Filter Type | Current Timeframe | MTF1 (15min) | MTF2 (4h) |
|-------------|-------------------|-------------|------------|
| RSI | Quick entries/exits | Intraday trend | Overall trend |
| Volume | Immediate liquidity | Sustained support | Market participation |
| Volatility | Entry timing | Short-term risk | Regime changes |
| KEMAD | Precise signals | Trend confirmation | Major reversals |
## Visual Indicators and Chart Analysis
The bot provides comprehensive visual feedback on the chart:
- **Channel Bands**: Keltner or MLMA bands showing potential support/resistance
- **Pivot SuperTrend**: Colored line showing trend direction and potential reversal points
- **Entry/Exit Markers**: Annotations showing actual trade entries and exits
- **Risk/Reward Zones**: Visual representation of stop-loss and take-profit levels
These visual elements allow for:
- Real-time strategy assessment
- Post-trade analysis and optimization
- Educational understanding of the strategy logic
## Implementation Guide
### TradingView Setup
1. Load the script in TradingView Pine Editor
2. Apply to your preferred chart and timeframe
3. Adjust parameters based on your trading preferences
4. Enable alerts for webhook integration
### Webhook Integration
1. Configure webhook URL in TradingView alerts
2. Set up receiving endpoint on your trading platform
3. Define message format matching the bot's output
4. Test with small position sizes before full deployment
### Optimization Process
1. Backtest across different market conditions
2. Identify parameter sensitivity through multiple tests
3. Focus on risk management parameters first
4. Fine-tune entry/exit conditions based on performance metrics
5. Validate with out-of-sample testing
## Performance Considerations
### Strengths
- Adaptability to different market conditions through dual channels
- Multiple layers of confirmation reducing false signals
- Comprehensive risk management protecting capital
- Machine learning integration for predictive edge
### Limitations
- Complex parameter set requiring careful optimization
- Potential over-optimization risk with so many variables
- Computational intensity of MLMA calculations
- Dependency on proper webhook configuration for execution
### Best Practices
- Start with conservative risk settings (1-2% of equity)
- Test thoroughly in demo environment before live trading
- Monitor performance regularly and adjust parameters
- Consider market regime changes when evaluating results
## Conclusion
The ₿ober XM v2.0 represents a significant evolution in trading strategy design, combining traditional technical analysis with machine learning elements and multi-timeframe analysis. The core strength of this system lies in its adaptability and recognition of market asymmetry.
### Market Asymmetry and Adaptive Approach
The strategy acknowledges a fundamental truth about markets: bullish and bearish phases behave differently and should be treated as distinct environments. The dual-channel system with separate parameters for long and short positions directly addresses this asymmetry, allowing for optimized performance regardless of market direction.
### Targeted Backtesting Philosophy
It's counterproductive to run backtests over excessively long periods. Markets evolve continuously, and strategies that worked in previous market regimes may be ineffective in current conditions. Instead:
- Test specific market phases separately (bull markets, bear markets, range-bound periods)
- Regularly re-optimize parameters as market conditions change
- Focus on recent performance with higher weight than historical results
- Test across multiple timeframes to ensure robustness
### Multi-Timeframe Analysis as a Game-Changer
The integration of multi-timeframe analysis fundamentally transforms the strategy's effectiveness:
- **Increased Safety**: Higher timeframe confirmations reduce false signals and improve trade quality
- **Context Awareness**: Decisions made with awareness of larger trends reduce adverse entries
- **Adaptable Precision**: Apply strict filters on lower timeframes while maintaining awareness of broader conditions
- **Reduced Noise**: Higher timeframe data naturally filters market noise that can trigger poor entries
The ₿ober XM v2.0 provides traders with a framework that acknowledges market complexity while offering practical tools to navigate it. With proper setup, realistic expectations, and attention to changing market conditions, it delivers a sophisticated approach to systematic trading that can be continuously refined and optimized.

Follow Line Strategy Version 2.5 (React HTF)Follow Line Strategy v2.5 (React HTF) - TradingView Script Usage
This strategy utilizes a "Follow Line" concept based on Bollinger Bands and ATR to identify potential trading opportunities. It includes advanced features like optional working hours filtering, higher timeframe (HTF) trend confirmation, and improved trend-following entry/exit logic. Version 2.5 introduces reactivity to HTF trend changes for more adaptive trading.
Key Features:
Follow Line: The core of the strategy. It dynamically adjusts based on price breakouts beyond Bollinger Bands, using either the low/high or ATR-adjusted levels.
Bollinger Bands: Uses a standard Bollinger Bands setup to identify overbought/oversold conditions.
ATR Filter: Optionally uses the Average True Range (ATR) to adjust the Follow Line offset, providing a more dynamic and volatility-adjusted entry point.
Optional Trading Session Filter: Allows you to restrict trading to specific hours of the day.
Higher Timeframe (HTF) Confirmation: A significant feature that allows you to confirm trade signals with the trend on a higher timeframe. This can help to filter out false signals and improve the overall win rate.
HTF Selection Method: Choose between Auto and Manual HTF selection:
Auto: The script automatically determines the appropriate HTF based on the current chart timeframe (e.g., 1min -> 15min, 5min -> 4h, 1h -> 1D, Daily -> Monthly).
Manual: Allows you to select a specific HTF using the Manual Higher Timeframe input.
Trend-Following Entries/Exits: The strategy aims to enter trades in the direction of the established trend, using the Follow Line to define the trend.
Reactive HTF Trend Changes: v2.5 exits positions not only based on the trade timeframe (TTF) trend changing, but also when the higher timeframe trend reverses against the position. This makes the strategy more responsive to larger market movements.
Alerts: Provides buy and sell alerts for convenient trading signal notifications.
Visualizations: Plots the Follow Line for both the trade timeframe and the higher timeframe (optional), making it easy to understand the strategy's logic.
How to Use:
Add to Chart: Add the "Follow Line Strategy Version 2.5 (React HTF)" script to your TradingView chart.
Configure Settings: Customize the strategy's settings to match your trading style and preferences. Here's a breakdown of the key settings:
Indicator Settings:
ATR Period: The period used to calculate the ATR. A smaller period is more sensitive to recent price changes.
Bollinger Bands Period: The period used for the Bollinger Bands calculation. A longer period results in smoother bands.
Bollinger Bands Deviation: The number of standard deviations from the moving average that the Bollinger Bands are plotted. Higher deviations create wider bands.
Use ATR for Follow Line Offset?: Enable to use ATR to calculate the Follow Line offset. Disable to use the simple high/low.
Show Trade Signals on Chart?: Enable to show BUY/SELL labels on the chart.
Time Filter:
Use Trading Session Filter?: Enable to restrict trading to specific hours of the day.
Trading Session: The trading session to use (e.g., 0930-1600 for regular US stock market hours). Use 0000-2400 for all hours.
Higher Timeframe Confirmation:
Enable HTF Confirmation?: Enable to use the HTF trend to filter trade signals. If enabled, only trades in the direction of the HTF trend will be taken.
HTF Selection Method: Choose between "Auto" and "Manual" HTF selection.
Manual Higher Timeframe: If "Manual" is selected, choose the specific HTF (e.g., 240 for 4 hours, D for daily).
Show HTF Follow Line?: Enable to plot the HTF Follow Line on the chart.
Understanding the Signals:
Buy Signal: The price breaks above the upper Bollinger Band, and the HTF (if enabled) confirms the uptrend.
Sell Signal: The price breaks below the lower Bollinger Band, and the HTF (if enabled) confirms the downtrend.
Exit Long: The trade timeframe trend changes to downtrend or the higher timeframe trend changes to downtrend.
Exit Short: The trade timeframe trend changes to uptrend or the higher timeframe trend changes to uptrend.
Alerts:
The script includes alert conditions for buy and sell signals. To set up alerts, click the "Alerts" button in TradingView and select the desired alert condition from the script. The alert message provides the ticker and interval.
Backtesting and Optimization:
Use TradingView's Strategy Tester to backtest the strategy on different assets and timeframes.
Experiment with different settings to optimize the strategy for your specific trading style and risk tolerance. Pay close attention to the ATR Period, Bollinger Bands settings, and the HTF confirmation options.
Tips and Considerations:
HTF Confirmation: The HTF confirmation can significantly improve the strategy's performance by filtering out false signals. However, it can also reduce the number of trades.
Risk Management: Always use proper risk management techniques, such as stop-loss orders and position sizing, when trading any strategy.
Market Conditions: The strategy may perform differently in different market conditions. It's important to backtest and optimize the strategy for the specific markets you are trading.
Customization: Feel free to modify the script to suit your specific needs. For example, you could add additional filters or entry/exit conditions.
Pyramiding: The pyramiding = 0 setting prevents multiple entries in the same direction, ensuring the strategy doesn't compound losses. You can adjust this value if you prefer to pyramid into winning positions, but be cautious.
Lookahead: The lookahead = barmerge.lookahead_off setting ensures that the HTF data is calculated based on the current bar's closed data, preventing potential future peeking bias.
Trend Determination: The logic for determining the HTF trend and reacting to changes is critical. Carefully review the f_calculateHTFData function and the conditions for exiting positions to ensure you understand how the strategy responds to different market scenarios.
Disclaimer:
This script is for informational and educational purposes only. It is not financial advice, and you should not trade based solely on the signals generated by this script. Always do your own research and consult with a qualified financial advisor before making any trading decisions. The author is not responsible for any losses incurred as a result of using this script.

IU Gap Fill StrategyThe IU Gap Fill Strategy is designed to capitalize on price gaps that occur between trading sessions. It identifies gaps based on a user-defined percentage threshold and executes trades when the price fills the gap within a day. This strategy is ideal for traders looking to take advantage of market inefficiencies that arise due to overnight or session-based price movements. An ATR-based trailing stop-loss is incorporated to dynamically manage risk and lock in profits.
USER INPUTS
Percentage Difference for Valid Gap - Defines the minimum gap size in percentage terms for a valid trade setup. ( Default is 0.2 )
ATR Length - Sets the lookback period for the Average True Range (ATR) calculation. (default is 14 )
ATR Factor - Determines the multiplier for the trailing stop-loss, helping in risk management. ( Default is 2.00 )
LONG CONDITION
A gap-up occurs, meaning the current session opens above the previous session’s close.
The price initially dips below the previous session's close but then recovers and closes above it.
The gap meets the valid percentage threshold set by the user.
The bar is not the first or last bar of the session to avoid false signals.
SHORT CONDITION
A gap-down occurs, meaning the current session opens below the previous session’s close.
The price initially moves above the previous session’s close but then closes below it.
The gap meets the valid percentage threshold set by the user.
The bar is not the first or last bar of the session to avoid false signals.
LONG EXIT
An ATR-based trailing stop-loss is set below the entry price and dynamically adjusts upwards as the price moves in favor of the trade.
The position is closed when the trailing stop-loss is hit.
SHORT EXIT
An ATR-based trailing stop-loss is set above the entry price and dynamically adjusts downwards as the price moves in favor of the trade.
The position is closed when the trailing stop-loss is hit.
WHY IT IS UNIQUE
Precision in Identifying Gaps - The strategy focuses on real price gaps rather than minor fluctuations.
Dynamic Risk Management - Uses ATR-based trailing stop-loss to secure profits while allowing the trade to run.
Versatility - Works on stocks, indices, forex, and any market that experiences session-based gaps.
Optimized Entry Conditions - Ensures entries are taken only when the price attempts to fill the gap, reducing false signals.
HOW USERS CAN BENEFIT FROM IT
Enhance Trade Timing - Captures high-probability trade setups based on market inefficiencies caused by gaps.
Minimize Risk - The ATR trailing stop-loss helps protect gains and limit losses.
Works in Different Market Conditions - Whether markets are trending or consolidating, the strategy adapts to potential gap fill opportunities.
Fully Customizable - Users can fine-tune gap percentage, ATR settings, and stop-loss parameters to match their trading style.

FVG Breakout Lite by tradingbauhausExplanation of "FVG Breakout Lite by tradingbauhaus"
This script is a trading strategy built for TradingView that helps you spot and trade "Fair Value Gaps" (FVGs)—price areas where the market moved quickly, leaving a gap that might act as support or resistance later. It’s designed to catch breakout opportunities when the price moves strongly in one direction, with extra filters to make trades more reliable. Here’s how it works and how you can use it:
What It Does
1. Finds Fair Value Gaps (FVGs):
A "Bullish FVG" happens when the price jumps up quickly, leaving a gap below where it didn’t trade much (e.g., today’s low is higher than the high from two bars ago).
A "Bearish FVG" is the opposite: the price drops fast, leaving a gap above (e.g., today’s high is lower than the low from two bars ago).
The script draws colored boxes on your chart to show these gaps: green for bullish, red for bearish.
2. Spots Breakouts:
It looks for "strong" FVGs by comparing them to a trend (based on the highest highs and lowest lows over a set period).
If a bullish gap forms above the recent highs, or a bearish gap below the recent lows, it’s marked as a breakout opportunity.
3. Adds a Volume Check:
Trades only happen if the market’s volume is higher than usual (e.g., 1.2x the average volume over the last 20 bars). This helps ensure the breakout has real momentum behind it.
4. Trades Automatically:
Long Trades (Buy): If a bullish breakout FVG forms and volume is high, it buys at the current price.
Short Trades (Sell): If a bearish breakout FVG forms with high volume, it sells short.
Each trade comes with a stop loss (to limit losses) and a take profit (to lock in gains), both adjustable by you.
5. Shows Mitigation Lines (Optional):
If you turn on "Display Mitigation Zones," it draws lines at the edge of each breakout FVG. These lines show where the price might return to "fill" the gap later, helping you see key levels.
6. Includes Webull Costs:
The script factors in real trading fees from Webull, like tiny SEC and FINRA fees for selling, and a daily margin cost if you’re borrowing money to trade. These don’t show up on the chart but affect the strategy’s performance in backtesting.
How to Use It
1. Add to Your Chart:
Copy the script into TradingView’s Pine Editor, click "Add to Chart," and it’ll start drawing FVGs and running the strategy.
2. Customize Settings:
Trend Period (Default: 25): How many bars it looks back to define the trend. Longer periods mean fewer but stronger signals.
Volume Lookback (Default: 20) & Volume Threshold (Default: 1.2): Adjust how it measures "high volume." Increase the threshold for stricter trades.
Stop Loss % (Default: 1.5%) & Take Profit % (Default: 3%): Set how much you’re willing to lose or aim to gain per trade.
Margin Rate % (Default: 8.74%): Webull’s rate for borrowing money—lower it if your account qualifies for a better rate.
Display Mitigation Zones (Default: On): Toggle this to see or hide the gap lines.
Colors: Change the green (bullish) and red (bearish) shades to suit your chart.
3. Backtest It:
Go to the "Strategy Tester" tab in TradingView to see how it performs on past data. It’ll show trades, profits, losses, and Webull fees included.
4. Watch It Work:
Green boxes mean bullish FVGs; red boxes mean bearish FVGs. If volume spikes and the price breaks out, you’ll see trades happen automatically.
What to Expect
Visuals: You’ll see colored boxes for FVGs and optional lines showing where they start. These help you spot key price zones even if you’re not trading.
Trades: It’s selective—only trades when FVGs align with a breakout and volume confirms it. Expect fewer trades but with higher potential.
Risk: The stop loss keeps losses in check, while the take profit aims for a 2:1 reward-to-risk ratio by default (3% gain vs. 1.5% loss).
Costs: Webull’s fees are small but baked into the results, so you’re seeing a realistic picture of profits.
Tips for Users
Test it on a small timeframe (like 5-minute charts) for day trading or a larger one (like daily) for swing trading.
Play with the volume threshold—if you get too few trades, lower it (e.g., 1.1); if too many, raise it (e.g., 1.5).
Watch how price reacts to the mitigation lines—they’re often support or resistance zones traders target.
This strategy is lightweight, focused, and built for traders who like breakouts with a bit of confirmation. It’s not foolproof (no strategy is!), but it gives you a clear way to trade FVGs with some smart filters.

IronBot v4IronBot v4 – Trading Strategy Overview
1. Quick Context
IronBot v4 is a trading strategy designed for users who want a simple yet effective approach to reading the markets. It uses a combination of Fibonacci retracement levels, custom logic triggers, and innovative modules (EMA validation, Iron Impulse Shield and Iron Auto Volume Detector) to identify potential entry and exit points, strengthening the strategy’s detection of sudden market volatility or shifts in trading volume.
2. Theoretical Details
Fibonacci Analysis
The script identifies recent market highs and lows, then calculates key Fibonacci levels (high- and low-based). These levels can help confirm potential reversals or trends.
EMA Option
When enabled, the exponential moving average (EMA) offers additional validation for trade entries. If the current price remains above a certain EMA threshold, long positions may be favored; conversely, if it stays below the EMA, short positions may be initiated.
IIS (Iron Impulse Shield)
IIS helps to filter out risky trades by measuring recent price shocks or surges. If an extreme movement is detected, the strategy may temporarily disable longs or shorts to avoid false signals.
IAVD (Iron Auto Volume Detector)
This functionality automatically detects the average market volume over a defined period (regardless of the market, since it relies on real data). When entering a position, it ensures that overall volume is high enough to confirm a genuinely active, robust market. By providing an additional filter, it can strengthen the decision-making process whenever the market’s participation level is in question.
Panel
IronBot v4 displays a real-time backtest panel that summarizes the selected configuration (including the current pair, analysis window, enabled filters), as well as showing net profit, applicable exchange fees, country taxes, and the final net balance. This gives traders an immediate overview of strategy performance and risk metrics.
What Pinescript Adds Visually
The script plots:
Fibonacci levels (highlighting potential reversal zones)
Trend lines indicating bullish (green) or bearish (red) lean
Optional EMA line
Optional Fibonacci forecast lines for anticipating future moves
Automatic labeling of entry, take-profit, and stop-loss levels, indicating the profit percentage of each trade.
3. Explanation of Inputs
The strategy exposes multiple inputs that can be toggled or configured by the user:
Analysis Window : Dictates how many bars to consider for high/low calculations and the fib retracement thresholds.
TRADES
Display TP/SL: For displaying Take profits and Stop loss.
Display Forecast: When enabled, this feature calculates and projects possible future Fibonacci retracements using historical data, helping traders anticipate potential upcoming trade setups.
Leverage: Only used for the Panel and not for trades. Lets you amplify your position size; higher leverage increases potential gains but also heightens risk. TradingView strategy is using properties for doing this.
Exchange Maker Fees & Exchange Taker Fees: Only used for the Panel and not for trades. Define the percentage cost applied by your exchange for maker and taker trades, respectively. These fees are accounted for in final profit calculations of the Panel.
Country Tax: Only used for the Panel and not for trades. Specifies a tax percentage to be deducted from net profits.
STOP LOSS and TAKE PROFITS
Stop-Loss & Take-Profit Parameters: Controls the percentage distances at which the strategy will exit positions. Additionally, you can configure up to four distinct take-profit levels (TP1 through TP4). Each level should be higher target than the previous one, and you can assign a specific percentage of the total position to close at each TP, ensuring the sum equals 100%. A break-even feature is also available when multiple TPs are used.
EMA
EMA (Exponential Moving Average) Option: When enabled, the strategy opens long trades only if the current price is above the specified EMA length, and opens short trades only if it is below that threshold.
PANELS
Show Panel: For displaying the backtest integrated panel.
IRON IMPULSE SHIELD (IIS)
IIS (Iron Impulse Shield) Option: When enabled, IIS continuously monitors recent price volatility depending on the analysis window set. If the market experiences an extreme surge or drop beyond a specified threshold, IIS temporarily blocks new long or short positions.
IRON AUTO VOLUME DETECTOR (IAVD)
IAVD (Iron Auto Volume Detector) Option: When enabled, it continuously measures the average market volume over a special period, irrespective of the specific trading pair. This ensures that IronBot v4 focuses on markets with robust participation, reducing the likelihood of entering trades during low-liquidity conditions.
By changing these values, IronBot v4 reacts differently to market structure and risk management requirements. Stop-loss and take-profit levels will adjust accordingly, while advanced filters (like EMA or IIS) influence when trades can open.
4. TradingView Strategy Properties
IronBot v4 uses the built-in TradingView “strategy” functionality. In particular:
Order Placement: The code calls strategy.entry() and strategy.close() for direct orders, ensuring signals are sent immediately (no limit orders are used). This helps connect with exchange signal bots for automated execution.
Initial Capital: The code uses initial capital defined in properties for calculating Net balance in the integrated panel.
On bar close: This strategy fill orders on bar close.
Pyramiding: This strategy can take only 1 successive trade in the same direction
Be careful to configure your leverage input depending on your strategy properties.
5. Visualization
5. Purpose & Disclaimer
This script is for educational purposes only and does not constitute financial advice. Past performance does not guarantee future results. Always confirm your own risk tolerance and consult a financial professional before placing live trades. Trading leveraged products can involve substantial risk of loss.

Bullish Reversal Bar Strategy [Skyrexio]Overview
Bullish Reversal Bar Strategy leverages the combination of candlestick pattern Bullish Reversal Bar (description in Methodology and Justification of Methodology), Williams Alligator indicator and Williams Fractals to create the high probability setups. Candlestick pattern is used for the entering into trade, while the combination of Williams Alligator and Fractals is used for the trend approximation as close condition. Strategy uses only long trades.
Unique Features
No fixed stop-loss and take profit: Instead of fixed stop-loss level strategy utilizes technical condition obtained by Fractals and Alligator or the candlestick pattern invalidation to identify when current uptrend is likely to be over (more information in "Methodology" and "Justification of Methodology" paragraphs)
Configurable Trading Periods: Users can tailor the strategy to specific market windows, adapting to different market conditions.
Trend Trade Filter: strategy uses Alligator and Fractal combination as high probability trend filter.
Methodology
The strategy opens long trade when the following price met the conditions:
1.Current candle's high shall be below the Williams Alligator's lines (Jaw, Lips, Teeth)(all details in "Justification of Methodology" paragraph)
2.Price shall create the candlestick pattern "Bullish Reversal Bar". Optionally if MFI and AO filters are enabled current candle shall have the decreasing AO and at least one of three recent bars shall have the squat state on the MFI (all details in "Justification of Methodology" paragraph)
3.If price breaks through the high of the candle marked as the "Bullish Reversal Bar" the long trade is open at the price one tick above the candle's high
4.Initial stop loss is placed at the Bullish Reversal Bar's candle's low
5.If price hit the Bullish Reversal Bar's low before hitting the entry price potential trade is cancelled
6.If trade is active and initial stop loss has not been hit, trade is closed when the combination of Alligator and Williams Fractals shall consider current trend change from upward to downward.
Strategy settings
In the inputs window user can setup strategy setting:
Enable MFI (if true trades are filtered using Market Facilitation Index (MFI) condition all details in "Justification of Methodology" paragraph), by default = false)
Enable AO (if true trades are filtered using Awesome Oscillator (AO) condition all details in "Justification of Methodology" paragraph), by default = false)
Justification of Methodology
Let's explore the key concepts of this strategy and understand how they work together. The first and key concept is the Bullish Reversal Bar candlestick pattern. This is just the single bar pattern. The rules are simple:
Candle shall be closed in it's upper half
High of this candle shall be below all three Alligator's lines (Jaw, Lips, Teeth)
Next, let’s discuss the short-term trend filter, which combines the Williams Alligator and Williams Fractals. Williams Alligator
Developed by Bill Williams, the Alligator is a technical indicator that identifies trends and potential market reversals. It consists of three smoothed moving averages:
Jaw (Blue Line): The slowest of the three, based on a 13-period smoothed moving average shifted 8 bars ahead.
Teeth (Red Line): The medium-speed line, derived from an 8-period smoothed moving average shifted 5 bars forward.
Lips (Green Line): The fastest line, calculated using a 5-period smoothed moving average shifted 3 bars forward.
When the lines diverge and align in order, the "Alligator" is "awake," signaling a strong trend. When the lines overlap or intertwine, the "Alligator" is "asleep," indicating a range-bound or sideways market. This indicator helps traders determine when to enter or avoid trades.
Fractals, another tool by Bill Williams, help identify potential reversal points on a price chart. A fractal forms over at least five consecutive bars, with the middle bar showing either:
Up Fractal: Occurs when the middle bar has a higher high than the two preceding and two following bars, suggesting a potential downward reversal.
Down Fractal: Happens when the middle bar shows a lower low than the surrounding two bars, hinting at a possible upward reversal.
Traders often use fractals alongside other indicators to confirm trends or reversals, enhancing decision-making accuracy.
How do these tools work together in this strategy? Let’s consider an example of an uptrend.
When the price breaks above an up fractal, it signals a potential bullish trend. This occurs because the up fractal represents a shift in market behavior, where a temporary high was formed due to selling pressure. If the price revisits this level and breaks through, it suggests the market sentiment has turned bullish.
The breakout must occur above the Alligator’s teeth line to confirm the trend. A breakout below the teeth is considered invalid, and the downtrend might still persist. Conversely, in a downtrend, the same logic applies with down fractals.
How we can use all these indicators in this strategy? This strategy is a counter trend one. Candle's high shall be below all Alligator's lines. During this market stage the bullish reversal bar candlestick pattern shall be printed. This bar during the downtrend is a high probability setup for the potential reversal to the upside: bulls were able to close the price in the upper half of a candle. The breaking of its high is a high probability signal that trend change is confirmed and script opens long trade. If market continues going down and break down the bullish reversal bar's low potential trend change has been invalidated and strategy close long trade.
If market really reversed and started moving to the upside strategy waits for the trend change form the downtrend to the uptrend according to approximation of Alligator and Fractals combination. If this change happens strategy close the trade. This approach helps to stay in the long trade while the uptrend continuation is likely and close it if there is a high probability of the uptrend finish.
Optionally users can enable MFI and AO filters. First of all, let's briefly explain what are these two indicators. The Awesome Oscillator (AO), created by Bill Williams, is a momentum-based indicator that evaluates market momentum by comparing recent price activity to a broader historical context. It assists traders in identifying potential trend reversals and gauging trend strength.
AO = SMA5(Median Price) − SMA34(Median Price)
where:
Median Price = (High + Low) / 2
SMA5 = 5-period Simple Moving Average of the Median Price
SMA 34 = 34-period Simple Moving Average of the Median Price
This indicator is filtering signals in the following way: if current AO bar is decreasing this candle can be interpreted as a bullish reversal bar. This logic is applicable because initially this strategy is a trend reversal, it is searching for the high probability setup against the current trend. Decreasing AO is the additional high probability filter of a downtrend.
Let's briefly look what is MFI. The Market Facilitation Index (MFI) is a technical indicator that measures the price movement per unit of volume, helping traders gauge the efficiency of price movement in relation to trading volume. Here's how you can calculate it:
MFI = (High−Low)/Volume
MFI can be used in combination with volume, so we can divide 4 states. Bill Williams introduced these to help traders interpret the interaction between volume and price movement. Here’s a quick summary:
Green Window (Increased MFI & Increased Volume): Indicates strong momentum with both price and volume increasing. Often a sign of trend continuation, as both buying and selling interest are rising.
Fake Window (Increased MFI & Decreased Volume): Shows that price is moving but with lower volume, suggesting weak support for the trend. This can signal a potential end of the current trend.
Squat Window (Decreased MFI & Increased Volume): Shows high volume but little price movement, indicating a tug-of-war between buyers and sellers. This often precedes a breakout as the pressure builds.
Fade Window (Decreased MFI & Decreased Volume): Indicates a lack of interest from both buyers and sellers, leading to lower momentum. This typically happens in range-bound markets and may signal consolidation before a new move.
For our purposes we are interested in squat bars. This is the sign that volume cannot move the price easily. This type of bar increases the probability of trend reversal. In this indicator we added to enable the MFI filter of reversal bars. If potential reversal bar or two preceding bars have squat state this bar can be interpret as a reversal one.
Backtest Results
Operating window: Date range of backtests is 2023.01.01 - 2024.12.31. It is chosen to let the strategy to close all opened positions.
Commission and Slippage: Includes a standard Binance commission of 0.1% and accounts for possible slippage over 5 ticks.
Initial capital: 10000 USDT
Percent of capital used in every trade: 50%
Maximum Single Position Loss: -5.29%
Maximum Single Profit: +29.99%
Net Profit: +5472.66 USDT (+54.73%)
Total Trades: 103 (33.98% win rate)
Profit Factor: 1.634
Maximum Accumulated Loss: 1231.15 USDT (-8.32%)
Average Profit per Trade: 53.13 USDT (+0.94%)
Average Trade Duration: 76 hours
How to Use
Add the script to favorites for easy access.
Apply to the desired timeframe and chart (optimal performance observed on 4h ETH/USDT).
Configure settings using the dropdown choice list in the built-in menu.
Set up alerts to automate strategy positions through web hook with the text: {{strategy.order.alert_message}}
Disclaimer:
Educational and informational tool reflecting Skyrex commitment to informed trading. Past performance does not guarantee future results. Test strategies in a simulated environment before live implementation
These results are obtained with realistic parameters representing trading conditions observed at major exchanges such as Binance and with realistic trading portfolio usage parameters.

Dynamic Support and Resistance Pivot Strategy The Dynamic Support and Resistance Pivot Strategy is a flexible and adaptive tool designed to identify short-term support and resistance levels using the concept of price pivots.
### Key Elements of the Strategy
1. Pivot points as support and resistance levels
Pivots are significant turning points on the price chart, often marking local highs and lows where the price has reversed direction. A pivot high occurs when the price forms a local peak, while a pivot low occurs when the price forms a local trough. When a new pivot high is formed, it creates a resistance level. Conversely, when a new pivot low is formed, it creates a support level.
The strategy continuously updates these levels as new pivots are detected, ensuring they remain relevant to the current market conditions. By identifying these price levels, the strategy dynamically adjusts to market conditions, allowing it to adapt to both trending and ranging markets, since it has a long target and can perform reversal operations.
2. Entry Criteria
- Buy (Long): A long position is triggered when the price is near the support level and then crosses it from below to above. This suggests that the price has found support and may start moving upwards.
- Sell (Short): A short position is triggered when the price is near the resistance level and then crosses it from above to below. This indicates that the price may be reversing and moving downward.
3. Support/Resistance distance (%)
- This parameter establishes a percentage range around the identified support and resistance level. For example, if the Support Resistance Distance is 0.4% (default), the closing price must be within a range of 0.4% above support or below the resistance to be considered "close" and trigger a trade.
4. Exit criteria
- Take profit = 27 %
- Stop loss = 10 %
- Reversal if a new entry point is identified in the opposite direction
5. No Repainting
- The Dynamic Support and Resistance Pivot Strategy is not subject to repainting.
6. Position Sizing by Equity and risk management
- This strategy has a default configuration to operate with 35% of the equity. The stop loss is set to 10% from the entry price. This way, the strategy is putting at risk about 10% of 35% of equity, that is, around 3.5% of equity for each trade. The percentage of equity and stop loss can be adjusted by the user according to their risk management.
7. Backtest results
- This strategy was subjected to backtest and operations in replay mode on **1000000MOGUSDT.P**, with the inclusion of transaction fees at 0.12% and slipagge of 5 ticks, and the past results have shown consistent profitability. Past results are no guarantee of future results. The strategy's backtest results may even be due to overfitting with past data.
8. Chart Visualization
- Support and resistance levels are displayed as green (support) and red (resistance) lines.
- Pivot prices are displayed as green (pivot low) and red (pivot high) labels.
In this image above, the Support/Resistance distance (%) parameter was set to 0.8.
9. Default Configuration
Chart Timeframe: 1h
Pivot Lengh: 2
Support/Resistance distance (%): 0.4*
Stop Loss: 10 %
Take Profit: 27 %
* This parameter can alternatively be set to 0.8.
10. Alternative Configuration
Chart Timeframe: 20 min
Pivot Lengh: 4
Support/Resistance distance (%): 0.1
Stop Loss: 10 %
Take Profit: 25 %
BYBIT:1000000MOGUSDT.P

Pivot & Source Cross StrategyPivot & ZoneCross Strategy V2
A powerful trading script combining Pivot Points, Retracement Zones, and Dynamic Stop-Loss Management. Suitable for beginners and advanced traders.
Introduction
This script enables traders to leverage Pivot Points and retracement zones for precise entry and exit points. Using price crossover detection and customizable stop-loss management, it offers a structured approach to trading various market conditions.
Features
Pivot Point Calculations: Select between Classic or Fibonacci methods for precise support and resistance levels.
Zone-Based Entry Signals: Identify price crossovers with retracement levels for optimal trade timing.
Customizable Stop-Loss Management: Automatically adjusts stop-loss levels to secure profits or limit losses.
Support for Market or Limit Orders: Choose instant market execution or specific limit entry points.
Flexible Inputs for Sources: Use Source First and Source Second to integrate external indicators like RSI and RSI MA, providing advanced customization options.
Visualization of Key Levels: Easily track retracement zones, Pivot Points, and stop-loss levels directly on the chart.
Configurable Conditions: Tailor entry/exit logic for your trading style.
How to Set Up
Choose Your Higher Timeframe (TIMEFRAME):
This determines the Pivot Points and retracement levels.
Example: Use “D” for daily pivots while trading on lower timeframes.
Select Entry Zone Patterns:
Define the pattern for detecting retracement levels:
xxx: Minor levels (steps of 10).
xx0: Intermediate levels (steps of 50).
x00: Major levels (steps of 100).
Set Entry Conditions for Long and Short Trades:
Activate or deactivate up/down conditions for xxx, xx0, or x00 patterns. Specify the count and range of crosses required for valid signals.
Configure Source Inputs (Source First and Source Second):
Assign external indicators such as RSI and RSI MA to refine entry conditions.
Tip: Adjust RSI settings in its separate indicator to suit your needs.
Select Your Order Type:
Choose between Market orders for instant execution or Limit orders for precision entries. Adjust offset zones for limit orders.
Set Up Stop-Loss Management:
Use dynamic stop-loss patterns with adjustable offsets:
HL: Stop-loss uses high/low levels of the zone.
Close: Stop-loss uses the closing price.
Customize Visualization Options:
Enable or disable xxx, xx0, x00, or 0 levels for cleaner charts. Adjust the display of retracement levels and stop-loss lines.
Apply and Monitor:
Attach the script to your chart, monitor entry/exit signals, and adjust parameters as needed.
How It Works
Calculates Pivot Points based on the chosen method ( Classic or Fibonacci ).
Detects price crossovers with retracement zones to identify potential entry points.
Dynamically adjusts stop-loss levels based on retracement zones and stop-loss patterns.
Supports both market and limit orders with customizable offsets for precise entries.
Allows integration of external sources like RSI for enhanced signal precision.
Important Notes
Use Source First and Source Second to input external indicators like RSI. You can configure RSI settings in its separate indicator to refine signals further.
Always test and optimize parameters before live trading.
Combine this script with your own analysis and proper risk management strategies.
This script is a tool to assist trading decisions but does not guarantee profits. Always trade responsibly.

MultiLayer Acceleration/Deceleration Strategy [Skyrexio]Overview
MultiLayer Acceleration/Deceleration Strategy leverages the combination of Acceleration/Deceleration Indicator(AC), Williams Alligator, Williams Fractals and Exponential Moving Average (EMA) to obtain the high probability long setups. Moreover, strategy uses multi trades system, adding funds to long position if it considered that current trend has likely became stronger. Acceleration/Deceleration Indicator is used for creating signals, while Alligator and Fractal are used in conjunction as an approximation of short-term trend to filter them. At the same time EMA (default EMA's period = 100) is used as high probability long-term trend filter to open long trades only if it considers current price action as an uptrend. More information in "Methodology" and "Justification of Methodology" paragraphs. The strategy opens only long trades.
Unique Features
No fixed stop-loss and take profit: Instead of fixed stop-loss level strategy utilizes technical condition obtained by Fractals and Alligator to identify when current uptrend is likely to be over (more information in "Methodology" and "Justification of Methodology" paragraphs)
Configurable Trading Periods: Users can tailor the strategy to specific market windows, adapting to different market conditions.
Multilayer trades opening system: strategy uses only 10% of capital in every trade and open up to 5 trades at the same time if script consider current trend as strong one.
Short and long term trend trade filters: strategy uses EMA as high probability long-term trend filter and Alligator and Fractal combination as a short-term one.
Methodology
The strategy opens long trade when the following price met the conditions:
1. Price closed above EMA (by default, period = 100). Crossover is not obligatory.
2. Combination of Alligator and Williams Fractals shall consider current trend as an upward (all details in "Justification of Methodology" paragraph)
3. Acceleration/Deceleration shall create one of two types of long signals (all details in "Justification of Methodology" paragraph). Buy stop order is placed one tick above the candle's high of last created long signal.
4. If price reaches the order price, long position is opened with 10% of capital.
5. If currently we have opened position and price creates and hit the order price of another one long signal, another one long position will be added to the previous with another one 10% of capital. Strategy allows to open up to 5 long trades simultaneously.
6. If combination of Alligator and Williams Fractals shall consider current trend has been changed from up to downtrend, all long trades will be closed, no matter how many trades has been opened.
Script also has additional visuals. If second long trade has been opened simultaneously the Alligator's teeth line is plotted with the green color. Also for every trade in a row from 2 to 5 the label "Buy More" is also plotted just below the teeth line. With every next simultaneously opened trade the green color of the space between teeth and price became less transparent.
Strategy settings
In the inputs window user can setup strategy setting: EMA Length (by default = 100, period of EMA, used for long-term trend filtering EMA calculation). User can choose the optimal parameters during backtesting on certain price chart.
Justification of Methodology
Let's explore the key concepts of this strategy and understand how they work together. We'll begin with the simplest: the EMA.
The Exponential Moving Average (EMA) is a type of moving average that assigns greater weight to recent price data, making it more responsive to current market changes compared to the Simple Moving Average (SMA). This tool is widely used in technical analysis to identify trends and generate buy or sell signals. The EMA is calculated as follows:
1.Calculate the Smoothing Multiplier:
Multiplier = 2 / (n + 1), Where n is the number of periods.
2. EMA Calculation
EMA = (Current Price) × Multiplier + (Previous EMA) × (1 − Multiplier)
In this strategy, the EMA acts as a long-term trend filter. For instance, long trades are considered only when the price closes above the EMA (default: 100-period). This increases the likelihood of entering trades aligned with the prevailing trend.
Next, let’s discuss the short-term trend filter, which combines the Williams Alligator and Williams Fractals. Williams Alligator
Developed by Bill Williams, the Alligator is a technical indicator that identifies trends and potential market reversals. It consists of three smoothed moving averages:
Jaw (Blue Line): The slowest of the three, based on a 13-period smoothed moving average shifted 8 bars ahead.
Teeth (Red Line): The medium-speed line, derived from an 8-period smoothed moving average shifted 5 bars forward.
Lips (Green Line): The fastest line, calculated using a 5-period smoothed moving average shifted 3 bars forward.
When the lines diverge and align in order, the "Alligator" is "awake," signaling a strong trend. When the lines overlap or intertwine, the "Alligator" is "asleep," indicating a range-bound or sideways market. This indicator helps traders determine when to enter or avoid trades.
Fractals, another tool by Bill Williams, help identify potential reversal points on a price chart. A fractal forms over at least five consecutive bars, with the middle bar showing either:
Up Fractal: Occurs when the middle bar has a higher high than the two preceding and two following bars, suggesting a potential downward reversal.
Down Fractal: Happens when the middle bar shows a lower low than the surrounding two bars, hinting at a possible upward reversal.
Traders often use fractals alongside other indicators to confirm trends or reversals, enhancing decision-making accuracy.
How do these tools work together in this strategy? Let’s consider an example of an uptrend.
When the price breaks above an up fractal, it signals a potential bullish trend. This occurs because the up fractal represents a shift in market behavior, where a temporary high was formed due to selling pressure. If the price revisits this level and breaks through, it suggests the market sentiment has turned bullish.
The breakout must occur above the Alligator’s teeth line to confirm the trend. A breakout below the teeth is considered invalid, and the downtrend might still persist. Conversely, in a downtrend, the same logic applies with down fractals.
In this strategy if the most recent up fractal breakout occurs above the Alligator's teeth and follows the last down fractal breakout below the teeth, the algorithm identifies an uptrend. Long trades can be opened during this phase if a signal aligns. If the price breaks a down fractal below the teeth line during an uptrend, the strategy assumes the uptrend has ended and closes all open long trades.
By combining the EMA as a long-term trend filter with the Alligator and fractals as short-term filters, this approach increases the likelihood of opening profitable trades while staying aligned with market dynamics.
Now let's talk about Acceleration/Deceleration signals. AC indicator is calculated using the Awesome Oscillator, so let's first of all briefly explain what is Awesome Oscillator and how it can be calculated. The Awesome Oscillator (AO), developed by Bill Williams, is a momentum indicator designed to measure market momentum by contrasting recent price movements with a longer-term historical perspective. It helps traders detect potential trend reversals and assess the strength of ongoing trends.
The formula for AO is as follows:
AO = SMA5(Median Price) − SMA34(Median Price)
where:
Median Price = (High + Low) / 2
SMA5 = 5-period Simple Moving Average of the Median Price
SMA 34 = 34-period Simple Moving Average of the Median Price
The Acceleration/Deceleration (AC) Indicator, introduced by Bill Williams, measures the rate of change in market momentum. It highlights shifts in the driving force of price movements and helps traders spot early signs of trend changes. The AC Indicator is particularly useful for identifying whether the current momentum is accelerating or decelerating, which can indicate potential reversals or continuations. For AC calculation we shall use the AO calculated above is the following formula:
AC = AO − SMA5(AO), where SMA5(AO)is the 5-period Simple Moving Average of the Awesome Oscillator
When the AC is above the zero line and rising, it suggests accelerating upward momentum.
When the AC is below the zero line and falling, it indicates accelerating downward momentum.
When the AC is below zero line and rising it suggests the decelerating the downtrend momentum. When AC is above the zero line and falling, it suggests the decelerating the uptrend momentum.
Now we can explain which AC signal types are used in this strategy. The first type of long signal is when AC value is below zero line. In this cases we need to see three rising bars on the histogram in a row after the falling one. The second type of signals occurs above the zero line. There we need only two rising AC bars in a row after the falling one to create the signal. The signal bar is the last green bar in this sequence. The strategy places the buy stop order one tick above the candle's high, which corresponds to the signal bar on AC indicator.
After that we can have the following scenarios:
Price hit the order on the next candle in this case strategy opened long with this price.
Price doesn't hit the order price, the next candle set lower high. If current AC bar is increasing buy stop order changes by the script to the high of this new bar plus one tick. This procedure repeats until price finally hit buy order or current AC bar become decreasing. In the second case buy order cancelled and strategy wait for the next AC signal.
If long trades are initiated, the strategy continues utilizing subsequent signals until the total number of trades reaches a maximum of 5. All open trades are closed when the trend shifts to a downtrend, as determined by the combination of the Alligator and Fractals described earlier.
Why we use AC signals? If currently strategy algorithm considers the high probability of the short-term uptrend with the Alligator and Fractals combination pointed out above and the long-term trend is also suggested by the EMA filter as bullish. Rising AC bars after period of falling AC bars indicates the high probability of local pull back end and there is a high chance to open long trade in the direction of the most likely main uptrend. The numbers of rising bars are different for the different AC values (below or above zero line). This is needed because if AC below zero line the local downtrend is likely to be stronger and needs more rising bars to confirm that it has been changed than if AC is above zero.
Why strategy use only 10% per signal? Sometimes we can see the false signals which appears on sideways. Not risking that much script use only 10% per signal. If the first long trade has been open and price continue going up and our trend approximation by Alligator and Fractals is uptrend, strategy add another one 10% of capital to every next AC signal while number of active trades no more than 5. This capital allocation allows to take part in long trades when current uptrend is likely to be strong and use only 10% of capital when there is a high probability of sideways.
Backtest Results
Operating window: Date range of backtests is 2023.01.01 - 2024.11.01. It is chosen to let the strategy to close all opened positions.
Commission and Slippage: Includes a standard Binance commission of 0.1% and accounts for possible slippage over 5 ticks.
Initial capital: 10000 USDT
Percent of capital used in every trade: 10%
Maximum Single Position Loss: -5.15%
Maximum Single Profit: +24.57%
Net Profit: +2108.85 USDT (+21.09%)
Total Trades: 111 (36.94% win rate)
Profit Factor: 2.391
Maximum Accumulated Loss: 367.61 USDT (-2.97%)
Average Profit per Trade: 19.00 USDT (+1.78%)
Average Trade Duration: 75 hours
How to Use
Add the script to favorites for easy access.
Apply to the desired timeframe and chart (optimal performance observed on 3h BTC/USDT).
Configure settings using the dropdown choice list in the built-in menu.
Set up alerts to automate strategy positions through web hook with the text: {{strategy.order.alert_message}}
Disclaimer:
Educational and informational tool reflecting Skyrex commitment to informed trading. Past performance does not guarantee future results. Test strategies in a simulated environment before live implementation
These results are obtained with realistic parameters representing trading conditions observed at major exchanges such as Binance and with realistic trading portfolio usage parameters.

MultiLayer Awesome Oscillator Saucer Strategy [Skyrexio]Overview
MultiLayer Awesome Oscillator Saucer Strategy leverages the combination of Awesome Oscillator (AO), Williams Alligator, Williams Fractals and Exponential Moving Average (EMA) to obtain the high probability long setups. Moreover, strategy uses multi trades system, adding funds to long position if it considered that current trend has likely became stronger. Awesome Oscillator is used for creating signals, while Alligator and Fractal are used in conjunction as an approximation of short-term trend to filter them. At the same time EMA (default EMA's period = 100) is used as high probability long-term trend filter to open long trades only if it considers current price action as an uptrend. More information in "Methodology" and "Justification of Methodology" paragraphs. The strategy opens only long trades.
Unique Features
No fixed stop-loss and take profit: Instead of fixed stop-loss level strategy utilizes technical condition obtained by Fractals and Alligator to identify when current uptrend is likely to be over (more information in "Methodology" and "Justification of Methodology" paragraphs)
Configurable Trading Periods: Users can tailor the strategy to specific market windows, adapting to different market conditions.
Multilayer trades opening system: strategy uses only 10% of capital in every trade and open up to 5 trades at the same time if script consider current trend as strong one.
Short and long term trend trade filters: strategy uses EMA as high probability long-term trend filter and Alligator and Fractal combination as a short-term one.
Methodology
The strategy opens long trade when the following price met the conditions:
1. Price closed above EMA (by default, period = 100). Crossover is not obligatory.
2. Combination of Alligator and Williams Fractals shall consider current trend as an upward (all details in "Justification of Methodology" paragraph)
3. Awesome Oscillator shall create the "Saucer" long signal (all details in "Justification of Methodology" paragraph). Buy stop order is placed one tick above the candle's high of last created "Saucer signal".
4. If price reaches the order price, long position is opened with 10% of capital.
5. If currently we have opened position and price creates and hit the order price of another one "Saucer" signal another one long position will be added to the previous with another one 10% of capital. Strategy allows to open up to 5 long trades simultaneously.
6. If combination of Alligator and Williams Fractals shall consider current trend has been changed from up to downtrend, all long trades will be closed, no matter how many trades has been opened.
Script also has additional visuals. If second long trade has been opened simultaneously the Alligator's teeth line is plotted with the green color. Also for every trade in a row from 2 to 5 the label "Buy More" is also plotted just below the teeth line. With every next simultaneously opened trade the green color of the space between teeth and price became less transparent.
Strategy settings
In the inputs window user can setup strategy setting: EMA Length (by default = 100, period of EMA, used for long-term trend filtering EMA calculation). User can choose the optimal parameters during backtesting on certain price chart.
Justification of Methodology
Let's go through all concepts used in this strategy to understand how they works together. Let's start from the easies one, the EMA. Let's briefly explain what is EMA. The Exponential Moving Average (EMA) is a type of moving average that gives more weight to recent prices, making it more responsive to current price changes compared to the Simple Moving Average (SMA). It is commonly used in technical analysis to identify trends and generate buy or sell signals. It can be calculated with the following steps:
1.Calculate the Smoothing Multiplier:
Multiplier = 2 / (n + 1), Where n is the number of periods.
2. EMA Calculation
EMA = (Current Price) × Multiplier + (Previous EMA) × (1 − Multiplier)
In this strategy uses EMA an initial long term trend filter. It allows to open long trades only if price close above EMA (by default 50 period). It increases the probability of taking long trades only in the direction of the trend.
Let's go to the next, short-term trend filter which consists of Alligator and Fractals. Let's briefly explain what do these indicators means. The Williams Alligator, developed by Bill Williams, is a technical indicator designed to spot trends and potential market reversals. It uses three smoothed moving averages, referred to as the jaw, teeth, and lips:
Jaw (Blue Line): The slowest of the three, based on a 13-period smoothed moving average shifted 8 bars ahead.
Teeth (Red Line): The medium-speed line, derived from an 8-period smoothed moving average shifted 5 bars forward.
Lips (Green Line): The fastest line, calculated using a 5-period smoothed moving average shifted 3 bars forward.
When these lines diverge and are properly aligned, the "alligator" is considered "awake," signaling a strong trend. Conversely, when the lines overlap or intertwine, the "alligator" is "asleep," indicating a range-bound or sideways market. This indicator assists traders in identifying when to act on or avoid trades.
The Williams Fractals, another tool introduced by Bill Williams, are used to pinpoint potential reversal points on a price chart. A fractal forms when there are at least five consecutive bars, with the middle bar displaying the highest high (for an up fractal) or the lowest low (for a down fractal), relative to the two bars on either side.
Key Points:
Up Fractal: Occurs when the middle bar has a higher high than the two preceding and two following bars, suggesting a potential downward reversal.
Down Fractal: Happens when the middle bar shows a lower low than the surrounding two bars, hinting at a possible upward reversal.
Traders often combine fractals with other indicators to confirm trends or reversals, improving the accuracy of trading decisions.
How we use their combination in this strategy? Let’s consider an uptrend example. A breakout above an up fractal can be interpreted as a bullish signal, indicating a high likelihood that an uptrend is beginning. Here's the reasoning: an up fractal represents a potential shift in market behavior. When the fractal forms, it reflects a pullback caused by traders selling, creating a temporary high. However, if the price manages to return to that fractal’s high and break through it, it suggests the market has "changed its mind" and a bullish trend is likely emerging.
The moment of the breakout marks the potential transition to an uptrend. It’s crucial to note that this breakout must occur above the Alligator's teeth line. If it happens below, the breakout isn’t valid, and the downtrend may still persist. The same logic applies inversely for down fractals in a downtrend scenario.
So, if last up fractal breakout was higher, than Alligator's teeth and it happened after last down fractal breakdown below teeth, algorithm considered current trend as an uptrend. During this uptrend long trades can be opened if signal was flashed. If during the uptrend price breaks down the down fractal below teeth line, strategy considered that uptrend is finished with the high probability and strategy closes all current long trades. This combination is used as a short term trend filter increasing the probability of opening profitable long trades in addition to EMA filter, described above.
Now let's talk about Awesome Oscillator's "Sauser" signals. Briefly explain what is the Awesome Oscillator. The Awesome Oscillator (AO), created by Bill Williams, is a momentum-based indicator that evaluates market momentum by comparing recent price activity to a broader historical context. It assists traders in identifying potential trend reversals and gauging trend strength.
AO = SMA5(Median Price) − SMA34(Median Price)
where:
Median Price = (High + Low) / 2
SMA5 = 5-period Simple Moving Average of the Median Price
SMA 34 = 34-period Simple Moving Average of the Median Price
Now we know what is AO, but what is the "Saucer" signal? This concept was introduced by Bill Williams, let's briefly explain it and how it's used by this strategy. Initially, this type of signal is a combination of the following AO bars: we need 3 bars in a row, the first one shall be higher than the second, the third bar also shall be higher, than second. All three bars shall be above the zero line of AO. The price bar, which corresponds to third "saucer's" bar is our signal bar. Strategy places buy stop order one tick above the price bar which corresponds to signal bar.
After that we can have the following scenarios.
Price hit the order on the next candle in this case strategy opened long with this price.
Price doesn't hit the order price, the next candle set lower low. If current AO bar is increasing buy stop order changes by the script to the high of this new bar plus one tick. This procedure repeats until price finally hit buy order or current AO bar become decreasing. In the second case buy order cancelled and strategy wait for the next "Saucer" signal.
If long trades has been opened strategy use all the next signals until number of trades doesn't exceed 5. All trades are closed when the trend changes to downtrend according to combination of Alligator and Fractals described above.
Why we use "Saucer" signals? If AO above the zero line there is a high probability that price now is in uptrend if we take into account our two trend filters. When we see the decreasing bars on AO and it's above zero it's likely can be considered as a pullback on the uptrend. When we see the stop of AO decreasing and the first increasing bar has been printed there is a high probability that this local pull back is finished and strategy open long trade in the likely direction of a main trend.
Why strategy use only 10% per signal? Sometimes we can see the false signals which appears on sideways. Not risking that much script use only 10% per signal. If the first long trade has been open and price continue going up and our trend approximation by Alligator and Fractals is uptrend, strategy add another one 10% of capital to every next saucer signal while number of active trades no more than 5. This capital allocation allows to take part in long trades when current uptrend is likely to be strong and use only 10% of capital when there is a high probability of sideways.
Backtest Results
Operating window: Date range of backtests is 2023.01.01 - 2024.11.25. It is chosen to let the strategy to close all opened positions.
Commission and Slippage: Includes a standard Binance commission of 0.1% and accounts for possible slippage over 5 ticks.
Initial capital: 10000 USDT
Percent of capital used in every trade: 10%
Maximum Single Position Loss: -5.10%
Maximum Single Profit: +22.80%
Net Profit: +2838.58 USDT (+28.39%)
Total Trades: 107 (42.99% win rate)
Profit Factor: 3.364
Maximum Accumulated Loss: 373.43 USDT (-2.98%)
Average Profit per Trade: 26.53 USDT (+2.40%)
Average Trade Duration: 78 hours
These results are obtained with realistic parameters representing trading conditions observed at major exchanges such as Binance and with realistic trading portfolio usage parameters.
How to Use
Add the script to favorites for easy access.
Apply to the desired timeframe and chart (optimal performance observed on 3h BTC/USDT).
Configure settings using the dropdown choice list in the built-in menu.
Set up alerts to automate strategy positions through web hook with the text: {{strategy.order.alert_message}}
Disclaimer:
Educational and informational tool reflecting Skyrex commitment to informed trading. Past performance does not guarantee future results. Test strategies in a simulated environment before live implementation

16. SMC Strategy with SL - low TimeframeOverview
The "SMC Strategy with SL - low Timeframe" is a comprehensive trading strategy that uses key concepts from Smart Money Theory to identify favorable areas in the market for buying or selling. This strategy takes advantage of price imbalances, support and resistance zones, and swing highs/lows to generate high-probability trade signals.
The key features of this strategy include:
Swing High/Low Analysis: Used to determine the Premium, Equilibrium, and Discount Zones.
Order Block Integration: An added layer of confluence to identify valid buy and sell signals.
Trend Direction Confirmation: Using a Simple Moving Average (SMA) to determine the overall trend.
Entry and Exit Rules: Based on price position relative to key zones and moving average, along with optional stop-loss and take-profit levels.
Detailed Description
Swing High and Swing Low Analysis
The script calculates Swing High and Swing Low based on the most recent price highs and lows over a specified look-back period (swingHighLength and swingLowLength, set to 8 by default).
It then derives the Premium, Equilibrium, and Discount Zones:
Premium Zone: Represents potential resistance, calculated based on recent swing highs.
Discount Zone: Represents potential support, calculated based on recent swing lows.
Equilibrium: The midpoint between Swing High and Swing Low, dividing the price range into Premium (above equilibrium) and Discount (below equilibrium) areas.
Zone Visualization
The strategy plots the Premium Zone (resistance) in red, the Discount Zone (support) in green, and the Equilibrium level in blue on the chart. This helps visually assess the current price relative to these important areas.
Simple Moving Average (SMA)
A 50-period Simple Moving Average (SMA) is added to help identify the trend direction.
Buy signals are valid only if the price is above the SMA, indicating an uptrend.
Sell signals are valid only if the price is below the SMA, indicating a downtrend.
Entry Rules
The script generates buy or sell signals when certain conditions are met:
A buy signal is triggered when:
Price is below the Equilibrium and within the Discount Zone.
Price is above the SMA.
The buy signal is further confirmed by the presence of an Order Block (recent lowest price area).
A sell signal is triggered when:
Price is above the Equilibrium and within the Premium Zone.
Price is below the SMA.
The sell signal is further confirmed by the presence of an Order Block (recent highest price area).
Order Block
The strategy defines Order Blocks as recent highs and lows within a look-back period (orderBlockLength set to 20 by default).
These blocks represent areas where large players (smart money) have historically been active, increasing the probability of the price reacting in these areas again.
Trade Management and Trade Direction
The user can set Trade Direction to either "Long Only," "Short Only," or "Both." This allows the strategy to adapt based on market conditions or trading preferences.
Based on the Trade Direction, the strategy either:
Closes open trades that are against new signals.
Allows only specific directional trades (either long or short).
Stop-loss levels are defined based on a fixed percentage (stop_loss_percent), which helps to manage risk and minimize losses.
Exit Rules
The strategy uses stop-loss levels for risk management.
A stop-loss price is set at a fixed percentage below the entry price for long positions or above the entry price for short positions.
When the price hits the defined stop-loss level, the trade is closed.
Liquidity Zones
The script identifies recent Swing Highs and Lows as potential liquidity zones. These are levels where price could react strongly, as they represent areas of interest for large traders.
The liquidity zones are plotted as crosses on the chart, marking areas where price may encounter significant buying or selling pressure.
Visual Feedback
The script uses visual markers (green for buy signals and red for sell signals) to indicate potential entries on the chart.
It also plots liquidity zones to help traders identify areas where stop hunts and liquidity grabs might occur.
Monthly Performance Dashboard
The script includes a performance tracking feature that displays monthly profit and loss metrics on the chart.
This dashboard allows the trader to see a visual representation of trading performance over time, providing insights into profitability and consistency.
The table shows profit or loss for each month and year, allowing the user to track the overall success of the strategy.
Key Benefits
Smart Money Concepts (SMC): This strategy incorporates SMC principles like order blocks and liquidity zones, which are used by institutional traders to determine potential market moves.
Zone Analysis: The use of Premium, Discount, and Equilibrium zones provides a solid framework for determining where to enter and exit trades based on price discounts or premiums.
Confluence: Signals are not taken in isolation. They are confirmed by factors like trend direction (SMA) and order blocks, providing greater trade accuracy.
Risk Management: By integrating stop-loss functionality, traders can manage their risks effectively.
Visual Performance Metrics: The monthly and yearly performance dashboard gives valuable feedback on how well the strategy has performed historically.
Practical Use
Buy in Discount Zone: Traders would be looking to buy when the price is discounted relative to its recent range and is above the SMA, indicating an overall uptrend.
Sell in Premium Zone: Conversely, traders would be looking to sell when the price is at a premium relative to its recent range and below the SMA, indicating an overall downtrend.
Order Block Confirmation: Ensures that buying or selling is supported by historical price behavior at significant levels, providing confidence that the market is likely to react at these areas.
This strategy is designed to help traders take advantage of price inefficiencies and areas where institutional traders are likely to be active, increasing the odds of successful trades. By leveraging Smart Money concepts and strong technical confluence, it aims to provide high-probability trade setups.

PTS - Bollinger Bands with Trailing StopPTS - Bollinger Bands with Trailing Stop Strategy
Overview
The "PTS - Bollinger Bands with Trailing Stop" strategy is designed to capitalize on strong bullish market movements by combining the Bollinger Bands indicator with a dynamic trailing stop based on the Average True Range (ATR). This strategy aims to enter long positions during upward breakouts and protect profits through an adaptive exit mechanism.
Key Features
1. Bollinger Bands Indicator
Basis Moving Average Type: Choose from SMA, EMA, SMMA, WMA, or VWMA for the Bollinger Bands' basis line. Length: Adjustable period for calculating the moving average and standard deviation (default is 20). Standard Deviation Multiplier (StdDev): Determines the width of the bands (default is 2.0). Source: Select the price data used for calculations (default is the closing price).
2. Entry Conditions
The strategy enters a long position when the closing price crosses above the upper Bollinger Band , indicating strong upward momentum.
3. Exit Conditions
Trailing Stop Loss: Implemented using ATR to adjust dynamically with market volatility. ATR Length: Period for calculating ATR (default is 14). ATR Multiplier for Trailing Stop: Determines how closely the trailing stop follows the price (default is 2.0). Close Below Lower Bollinger Band: The strategy exits the long position if the closing price crosses below the lower Bollinger Band .
4. Risk Management
Commission and Slippage: Commission is set at 0.1%; slippage is set to 3. Position Sizing: Uses 100% of equity per trade (adjustable).
5. Date Range Filter
Specify the time period during which the strategy is active. Start Date: January 1, 2018. End Date: December 31, 2069.
Customizable Inputs
BB Length: Adjust the period for Bollinger Bands calculation. BB StdDev: Modify the standard deviation multiplier. Basis MA Type: Select the moving average type. Source: Choose the price data source. Offset: Shift the Bollinger Bands on the chart. ATR Length: Set the period for ATR calculation. ATR Multiplier for Trailing Stop: Adjust the trailing stop sensitivity.
Thought for 1m 7s
Description for the "PTS - Bollinger Bands with Trailing Stop" Strategy
PTS - Bollinger Bands with Trailing Stop Strategy
Overview
The "PTS - Bollinger Bands with Trailing Stop" strategy is designed to capitalize on strong bullish market movements by combining the Bollinger Bands indicator with a dynamic trailing stop based on the Average True Range (ATR). This strategy aims to enter long positions during upward breakouts and protect profits through an adaptive exit mechanism.
Key Features
1. Bollinger Bands Indicator
Basis Moving Average Type: Choose from SMA, EMA, SMMA, WMA, or VWMA for the Bollinger Bands' basis line. Length: Adjustable period for calculating the moving average and standard deviation (default is 20). Standard Deviation Multiplier (StdDev): Determines the width of the bands (default is 2.0). Source: Select the price data used for calculations (default is the closing price).
2. Entry Conditions
The strategy enters a long position when the closing price crosses above the upper Bollinger Band , indicating strong upward momentum.
3. Exit Conditions
Trailing Stop Loss: Implemented using ATR to adjust dynamically with market volatility. ATR Length: Period for calculating ATR (default is 14). ATR Multiplier for Trailing Stop: Determines how closely the trailing stop follows the price (default is 2.0). Close Below Lower Bollinger Band: The strategy exits the long position if the closing price crosses below the lower Bollinger Band .
4. Risk Management
Commission and Slippage: Commission is set at 0.1%; slippage is set to 3. Position Sizing: Uses 100% of equity per trade (adjustable).
5. Date Range Filter
Specify the time period during which the strategy is active. Start Date: January 1, 2018. End Date: December 31, 2069.
Customizable Inputs
BB Length: Adjust the period for Bollinger Bands calculation. BB StdDev: Modify the standard deviation multiplier. Basis MA Type: Select the moving average type. Source: Choose the price data source. Offset: Shift the Bollinger Bands on the chart. ATR Length: Set the period for ATR calculation. ATR Multiplier for Trailing Stop: Adjust the trailing stop sensitivity.
How the Strategy Works
1. Initialization
Calculates Bollinger Bands and ATR based on selected parameters.
2. Entry Logic
Opens a long position when the closing price exceeds the upper Bollinger Band.
3. Exit Logic
Uses a trailing stop loss based on ATR. Exits if the closing price drops below the lower Bollinger Band.
4. Date Filtering
Executes trades only within the specified date range.
Advantages
Adaptive Risk Management: Trailing stop adjusts to market volatility. Simplicity: Clear entry and exit signals. Customizable Parameters: Tailor the strategy to different assets or conditions.
Considerations
Aggressive Position Sizing: Using 100% equity per trade is high-risk. Market Conditions: Best in trending markets; may produce false signals in sideways markets. Backtesting: Always test on historical data before live trading.
Disclaimer
This strategy is intended for educational and informational purposes only. Trading involves significant risk, and past performance is not indicative of future results. Assess your financial situation and consult a financial advisor if necessary.
Usage Instructions
1. Apply the Strategy: Add it to your TradingView chart. 2. Configure Inputs: Adjust parameters to suit your style and asset. 3. Analyze Backtest Results: Use the Strategy Tester. 4. Optimize Parameters: Experiment with input values. 5. Risk Management: Evaluate position sizing and incorporate risk controls.
Final Notes
The "PTS - Bollinger Bands with Trailing Stop" strategy provides a framework to leverage momentum breakouts while managing risk through adaptive trailing stops. Customize and test thoroughly to align with your trading objectives.

Trade Entry Detector, Wick to Body Ratio Trade Entry Detector: Wick-to-Body Ratio Strategy with Bollinger Bands
Overview
The Trade Entry Detector is a custom strategy for TradingView that leverages the Bollinger Bands and a unique wick-to-body ratio approach to capture precise entry opportunities. This indicator is designed for traders who want to pinpoint high-probability reversal points when price interacts with Bollinger Bands, all while offering flexible entry fill options.
The strategy performs primary analysis on the daily time frame, regardless of your current chart setting, allowing you to view daily Bollinger Band levels and entry signals even on lower time frames. This approach is suitable for swing traders and short-term traders looking to align intraday moves with higher time frame signals.
How the Strategy Works
1. Bollinger Band Analysis on the Daily Time Frame
Bollinger Bands are calculated using a 20-period simple moving average (SMA) and a standard deviation multiplier (default is 2). These bands dynamically expand and contract based on market volatility, making them ideal for identifying overbought and oversold conditions:
* Upper Band: Indicates potential overbought levels.
* Lower Band: Indicates potential oversold levels.
2. Wick-to-Body Ratio Condition
This strategy places significant emphasis on candle wicks relative to the candle body. Here’s why:
* A large upper wick relative to the body signals potential selling pressure after testing the upper Bollinger Band.
* A large lower wick relative to the body indicates buying support after testing the lower Bollinger Band.
* Ratio Threshold: You can set a minimum wick-to-body ratio (default is 1.0), meaning that the wick must be at least equal in size to the body. This ensures only candles with significant reversals are considered for entry.
3. Flexible Entry Timing
To adapt to various trading styles, the indicator allows you to choose the entry fill timing:
* Daily Close: Enter at the close of the daily candle.
* Daily Open: Enter at the open of the following daily candle.
* HOD (High of Day): Set entry at the daily high, for those who want confirmation of upward momentum.
* LOD (Low of Day): Set entry at the daily low, ideal for confirming downward movement.
4. Position Sizing and Risk Management
The strategy calculates position size based on a fixed risk percentage of your account balance (default is 1%). This approach dynamically adjusts position sizes based on stop-loss distance:
* Stop Loss: Placed at the nearest swing high (for shorts) or swing low (for longs).
* Take Profit: Exits are triggered when the price reaches the opposite Bollinger Band.
5. Order Expiration
Each pending order (long or short) expires after two days if unfilled, allowing for new setups on subsequent candles if conditions are met again.
Using the Trade Entry Detector
Step-by-Step Guide
1. Set the Primary Time Frame
The core calculations run on the daily time frame, but the strategy can be applied to intraday charts (e.g., 65-minute or 15-minute) for deeper insights.
2. Adjust Bollinger Band Settings
* Length: Default is 20, which determines the period for calculating the moving average.
* Standard Deviation Multiplier: Default is 2.0, which sets the width of the bands. Adjusting this can help you capture broader or tighter volatility ranges.
3. Define the Wick-to-Body Ratio
Set the minimum ratio between wick and body (default 1.0). Higher values filter out candles with less wick-to-body contrast, focusing on stronger rejection moves.
4. Choose Entry Fill Timing
Select your preferred fill condition:
* Daily Close: Confirms the trade at the end of the daily session.
* Daily Open: Executes the entry at the open of the next day.
* HOD/LOD: Uses the daily high or low as an additional confirmation for upward or downward moves.
5. Position Sizing and Risk Management
* Set your account balance and risk percentage. The strategy automatically calculates position sizes based on the stop distance to manage risk efficiently.
* Stop Loss and Take Profit points are automatically set based on swing highs/lows and opposing Bollinger Bands, respectively.
Practical Example
Let’s say SPY (S&P 500 ETF) tests the lower Bollinger Band on the daily time frame, with a lower wick that is twice the size of the body (meeting the 1.0 ratio threshold). Here’s how the strategy might proceed:
1. Signal: The lower wick on SPY suggests buying interest at the lower Bollinger Band.
2. Entry Fill Timing: If you’ve selected "Daily Open," the entry order will be placed at the next day's open price.
3. Stop Loss: Positioned at the nearest daily swing low to minimize risk.
4. Take Profit: If SPY price moves up and reaches the upper Bollinger Band, the position is automatically closed.
Indicator Features and Benefits
* Multi-Time Frame Compatibility: Perform daily analysis while tracking signals on any intraday chart.
* Automatic Position Sizing: Tailor risk per trade based on account balance and desired risk percentage.
* Flexible Entry Options: Choose from close, open, HOD, or LOD for optimal timing.
* Effective Trend Reversal Identification: Uses wick-to-body ratio and Bollinger Band interaction to pinpoint potential reversals.
* Dynamic Visualization: Bollinger Bands are displayed on your chosen time frame, allowing seamless intraday tracking.
Summary
The Trade Entry Detector provides a unique, data-driven way to spot reversal points with customizable entry options. By combining Bollinger Bands with wick-to-body ratio conditions, it identifies potential trade setups where price has tested extremes and shown reversal signals. With its flexible entry timing, risk management features, and multi-time frame compatibility, this indicator is ideal for traders looking to blend daily market context with shorter-term execution.
Tips for Usage:
* For swing trading, consider the Daily Open or Close entry options.
* For momentum entries, HOD or LOD may offer better alignment with the direction of the wick.
* Backtest on different assets to find optimal Bollinger Band and wick-to-body settings for your market.
Use this indicator to enhance your understanding of price behavior at key levels and improve the precision of your entry points. Happy trading!

Gold Scalping Strategy with Precise EntriesThe Gold Scalping Strategy with Precise Entries is designed to take advantage of short-term price movements in the gold market (XAU/USD). This strategy uses a combination of technical indicators and chart patterns to identify precise buy and sell opportunities during times of consolidation and trend continuation.
Key Elements of the Strategy:
Exponential Moving Averages (EMAs):
50 EMA: Used as the shorter-term moving average to detect the recent price trend.
200 EMA: Used as the longer-term moving average to determine the overall market trend.
Trend Identification:
A bullish trend is identified when the 50 EMA is above the 200 EMA.
A bearish trend is identified when the 50 EMA is below the 200 EMA.
Average True Range (ATR):
ATR (14) is used to calculate the market's volatility and to set a dynamic stop loss based on recent price movements. Higher ATR values indicate higher volatility.
ATR helps define a suitable stop-loss distance from the entry point.
Relative Strength Index (RSI):
RSI (14) is used as a momentum oscillator to detect overbought or oversold conditions.
However, in this strategy, the RSI is primarily used as a consolidation filter to look for neutral zones (between 45 and 55), which may indicate a potential breakout or trend continuation after a consolidation phase.
Engulfing Patterns:
Bullish Engulfing: A bullish signal is generated when the current candle fully engulfs the previous bearish candle, indicating potential upward momentum.
Bearish Engulfing: A bearish signal is generated when the current candle fully engulfs the previous bullish candle, signaling potential downward momentum.
Precise Entry Conditions:
Long (Buy):
The 50 EMA is above the 200 EMA (bullish trend).
The RSI is between 45 and 55 (neutral/consolidation zone).
A bullish engulfing pattern occurs.
The price closes above the 50 EMA.
Short (Sell):
The 50 EMA is below the 200 EMA (bearish trend).
The RSI is between 45 and 55 (neutral/consolidation zone).
A bearish engulfing pattern occurs.
The price closes below the 50 EMA.
Take Profit and Stop Loss:
Take Profit: A fixed 20-pip target (where 1 pip = 0.10 movement in gold) is used for each trade.
Stop Loss: The stop-loss is dynamically set based on the ATR, ensuring that it adapts to current market volatility.
Visual Signals:
Buy and sell signals are visually plotted on the chart using green and red labels, indicating precise points of entry.
Advantages of This Strategy:
Trend Alignment: The strategy ensures that trades are taken in the direction of the overall trend, as indicated by the 50 and 200 EMAs.
Volatility Adaptation: The use of ATR allows the stop loss to adapt to the current market conditions, reducing the risk of premature exits in volatile markets.
Precise Entries: The combination of engulfing patterns and the neutral RSI zone provides a high-probability entry signal that captures momentum after consolidation.
Quick Scalping: With a fixed 20-pip profit target, the strategy is designed to capture small price movements quickly, which is ideal for scalping.
This strategy can be applied to lower timeframes (such as 1-minute, 5-minute, or 15-minute charts) for frequent trade opportunities in gold trading, making it suitable for day traders or scalpers. However, proper risk management should always be used due to the inherent volatility of gold.

Optimized Heikin Ashi Strategy with Buy/Sell OptionsStrategy Name:
Optimized Heikin Ashi Strategy with Buy/Sell Options
Description:
The Optimized Heikin Ashi Strategy is a trend-following strategy designed to capitalize on market trends by utilizing the smoothness of Heikin Ashi candles. This strategy provides flexible options for trading, allowing users to choose between Buy Only (long-only), Sell Only (short-only), or using both in alternating conditions based on the Heikin Ashi candle signals. The strategy works on any market, but it performs especially well in markets where trends are prevalent, such as cryptocurrency or Forex.
This script offers customizable parameters for the backtest period, Heikin Ashi timeframe, stop loss, and take profit levels, allowing traders to optimize the strategy for their preferred markets or assets.
Key Features:
Trade Type Options:
Buy Only: Enter a long position when a green Heikin Ashi candle appears and exit when a red candle appears.
Sell Only: Enter a short position when a red Heikin Ashi candle appears and exit when a green candle appears.
Stop Loss and Take Profit:
Customizable stop loss and take profit percentages allow for flexible risk management.
The default stop loss is set to 2%, and the default take profit is set to 4%, maintaining a favorable risk/reward ratio.
Heikin Ashi Timeframe:
Traders can select the desired timeframe for Heikin Ashi candle calculation (e.g., 4-hour Heikin Ashi candles for a 1-hour chart).
The strategy smooths out price action and reduces noise, providing clearer signals for entry and exit.
Inputs:
Backtest Start Date / End Date: Specify the period for testing the strategy’s performance.
Heikin Ashi Timeframe: Select the timeframe for Heikin Ashi candle generation. A higher timeframe helps smooth the trend, which is beneficial for trading lower timeframes.
Stop Loss (in %) and Take Profit (in %): Enable or disable stop loss and take profit, and adjust the levels based on market conditions.
Trade Type: Choose between Buy Only or Sell Only based on your market outlook and strategy preference.
Strategy Performance:
In testing with BTC/USD, this strategy performed well in a 4-hour Heikin Ashi timeframe applied on a 1-hour chart over a period from January 1, 2024, to September 12, 2024. The results were as follows:
Initial Capital: 1 USD
Order Size: 100% of equity
Net Profit: +30.74 USD (3,073.52% return)
Percent Profitable: 78.28% of trades were winners.
Profit Factor: 15.825, indicating that the strategy's profitable trades far outweighed its losses.
Max Drawdown: 4.21%, showing low risk exposure relative to the large profit potential.
This strategy is ideal for both beginner and advanced traders who are looking to follow trends and avoid market noise by using Heikin Ashi candles. It is also well-suited for traders who prefer automated risk management through the use of stop loss and take profit levels.
Recommended Use:
Best Markets: This strategy works well on trending markets like cryptocurrency, Forex, or indices.
Timeframes: Works best when applied to lower timeframes (e.g., 1-hour chart) with a higher Heikin Ashi timeframe (e.g., 4-hour candles) to smooth out price action.
Leverage: The strategy performs well with leverage, but users should consider using 2x to 3x leverage to avoid excessive risk and potential liquidation. The strategy's low drawdown allows for moderate leverage use while maintaining risk control.
Customization: Traders can adjust the stop loss and take profit percentages based on their risk appetite and market conditions. A default setting of a 2% stop loss and 4% take profit provides a balanced risk/reward ratio.
Notes:
Risk Management: Traders should enable stop loss and take profit settings to maintain effective risk management and prevent large drawdowns during volatile market conditions.
Optimization: This strategy can be further optimized by adjusting the Heikin Ashi timeframe and risk parameters based on specific market conditions and assets.
Backtesting: The built-in backtesting functionality allows traders to test the strategy across different market conditions and historical data to ensure robustness before applying it to live trading.
How to Apply:
Select your preferred market and chart.
Choose the appropriate Heikin Ashi timeframe based on the chart's timeframe. (e.g., use 4-hour Heikin Ashi candles for 1-hour chart trends).
Adjust stop loss and take profit based on your risk management preference.
Run backtesting to evaluate its performance before applying it in live trading.
This strategy can be further modified and optimized based on personal trading style and market conditions. It’s important to monitor performance regularly and adjust settings as needed to align with market behavior.

Larry Connors 3 Day High/Low StrategyThe Larry Connors 3 Day High/Low Strategy is a short-term mean-reversion trading strategy that is designed to identify potential buying opportunities when a security is oversold. This strategy is based on the principles developed by Larry Connors, a well-known trading system developer and author.
Key Strategy Elements:
1. Trend Confirmation: The strategy first confirms that the security is in a long-term uptrend by ensuring that the closing price is above the 200-day moving average (condition1). This rule helps filter trades to align with the longer-term trend.
2. Short-Term Pullback: The strategy looks for a short-term pullback by ensuring that the closing price is below the 5-day moving average (condition2). This identifies potential entry points when the price temporarily moves against the longer-term trend.
3. Three Consecutive Lower Highs and Lows:
• The high and low two days ago are lower than those of the day before (condition3).
• The high and low yesterday are lower than those of two days ago (condition4).
• Today’s high and low are lower than yesterday’s (condition5).
These conditions are used to identify a sequence of declining highs and lows, signaling a short-term pullback or oversold condition in the context of an overall uptrend.
4. Entry and Exit Signals:
• Buy Signal: A buy order is triggered when all the above conditions are met (buyCondition).
• Sell Signal: A sell order is executed when the closing price is above the 5-day moving average (sellCondition), indicating that the pullback might be ending.
Risks of the Strategy
1. Mean Reversion Failure: This strategy relies on the assumption that prices will revert to the mean after a short-term pullback. In strong downtrends or during market crashes, prices may continue to decline, leading to significant losses.
2. Whipsaws and False Signals: The strategy may generate false signals, especially in choppy or sideways markets where the price does not follow a clear trend. This can lead to frequent small losses that can add up over time.
3. Dependence on Historical Patterns: The strategy is based on historical price patterns, which do not always predict future price movements accurately. Sudden market news or economic changes can disrupt the pattern.
4. Lack of Risk Management: The strategy as written does not include stop losses or position sizing rules, which can expose traders to larger-than-expected losses if conditions change rapidly.
About Larry Connors
Larry Connors is a renowned trader, author, and founder of Connors Research and TradingMarkets.com. He is widely recognized for his development of quantitative trading strategies, especially those focusing on short-term mean reversion techniques. Connors has authored several books on trading, including “Short-Term Trading Strategies That Work” and “Street Smarts,” co-authored with Linda Raschke. His strategies are known for their systematic, rules-based approach and have been widely used by traders and investment professionals.
Connors’ research often emphasizes the importance of trading with the trend, managing risk, and using statistically validated techniques to improve trading outcomes. His work has been influential in the field of quantitative trading, providing accessible strategies for traders at various skill levels.
References
1. Connors, L., & Raschke, L. (1995). Street Smarts: High Probability Short-Term Trading Strategies.
2. Connors, L. (2009). Short-Term Trading Strategies That Work.
3. Fama, E. F., & French, K. R. (1988). Permanent and Temporary Components of Stock Prices. Journal of Political Economy, 96(2), 246-273.
This strategy and its variations are popular among traders looking to capitalize on short-term price movements while aligning with longer-term trends. However, like all trading strategies, it requires rigorous backtesting and risk management to ensure its effectiveness under different market conditions.

Strategy SEMA SDI WebhookPurpose of the Code:
The strategy utilizes Exponential Moving Averages (EMA) and Smoothed Directional Indicators (SDI) to generate buy and sell signals. It includes features like leverage, take profit, stop loss, and trailing stops. The strategy is intended for backtesting and automating trades based on the specified indicators and conditions.
Key Components and Functionalities:
1.Strategy Settings:
Overlay: The strategy will overlay on the price chart.
Slippage: Set to 1.
Commission Value: Set to 0.035.
Default Quantity Type: Percent of equity.
Default Quantity Value: 50% of equity.
Initial Capital: Set to 1000 units.
Calculation on Order Fills: Enabled.
Process Orders on Close: Enabled.
2.Date and Time Filters:
Inputs for enabling/disabling start and end dates.
Filters to execute strategy only within specified date range.
3.Leverage and Quantity:
Leverage: Adjustable leverage input (default 3).
USD Percentage: Adjustable percentage of equity to use for trades (default 50%).
Initial Capital: Calculated based on leverage and percentage of equity.
4.Take Profit, Stop Loss, and Trailing Stop:
Inputs for enabling/disabling take profit, stop loss, and trailing stop.
Adjustable parameters for take profit percentage (default 25%), stop loss percentage (default 4.8%), and trailing stop percentage (default 1.9%).
Calculations for take profit, stop loss, trailing price, and maximum profit tracking.
5.EMA Calculations:
Fast and slow EMAs.
Smoothed versions of the fast and slow EMAs.
6.SDI Calculations:
Directional movement calculation for positive and negative directional indicators.
Difference between the positive and negative directional indicators, smoothed.
7.Buy/Sell Conditions:
Long (Buy) Condition: Positive DI is greater than negative DI, and fast EMA is greater than slow EMA.
Short (Sell) Condition: Negative DI is greater than positive DI, and fast EMA is less than slow EMA.
8.Strategy Execution:
If buy conditions are met, close any short positions and enter a long position.
If sell conditions are met, close any long positions and enter a short position.
Exit conditions for long and short positions based on take profit, stop loss, and trailing stop levels.
Close all positions if outside the specified date range.
Usage:
This strategy is used to automate trading based on the specified conditions involving EMAs and SDI. It allows backtesting to evaluate performance based on historical data. The strategy includes risk management through take profit, stop loss, and trailing stops to protect gains and limit losses. Traders can customize the parameters to fit their specific trading preferences and risk tolerance. Differently, it can perform leverage analysis and use it as a template.
By using this strategy, traders can systematically execute trades based on technical indicators, helping to remove emotional bias and improve consistency in trading decisions.
Important Note:
This script is provided for educational and template purposes and does not constitute financial advice. Traders and investors should conduct their research and analysis before making any trading decisions.
